Cancer in Wales – trends and projections
Authors: Rosemary Walmsley, Leon May, Serenay Ozalp, Jonathan Rees, Ffion Thomas, Rebecca Thomas, Dyfed Wyn Huws, Louisa Nolan, Llion Davies
Published on: 2nd September 2025
- All Wales/National
Purpose
This article is about the past, current, and future impact of cancer in Wales. It includes:
- Information on how we can reduce the impact of cancer.
- New projections of cancer incidence up to 2035, both overall and for three of the four most common cancer types.
- Discussion of historical data on cancer incidence, mortality and survival.
Headlines
- By 2035, we project that there will be around 24,000 new cancer cases each year among people living in Wales, up from around 20,000 in 2019. This is mostly because there will be more older people than in the past, and cancer is more common in older people.
- Cancer causes around 1 in 4 of all deaths of people living in Wales (2024).
- The likelihood people would survive from cancer for 5 years or more after being diagnosed went up between 2002 and 2018. Although more people are living for years after diagnosis, survival still depends on the type of cancer and how early it is diagnosed.
- The four most common cancer types are: prostate cancer, breast cancer, lung cancer, and colorectal (bowel) cancer.
- By 2035, we project that there will be more cases of prostate cancer, breast cancer and colorectal cancer each year than today. Uncertainties about the impact of smoking and the potential impact of screening meant we were unable to project lung cancer cases.
- Lung cancer causes the most cancer deaths. Smoking is the biggest risk factor. Other risks include exposure to air pollution and harmful substances in the workplace.
- Cancer is not the same for everyone. After accounting for age, people living in the most deprived fifth of areas are 1.2 times more likely to get cancer than people living in the least deprived fifth of areas. They are also less likely to survive from cancer for at least 5 years after being diagnosed.
- As of 2015, around 4 in 10 new cancer cases – or over 7,000 new cancer cases each year – in Wales were linked to risk factors that we could potentially change (Brown et al., 2018). These risk factors include smoking and living with overweight/ obesity, among many others.
Cancer in Wales – impact and trends
What impact does cancer have in Wales?
- New cases: In 2019, 20,392 new cases of cancer (excluding non-melanoma skin cancer) were diagnosed in people living in Wales (Cancer_Reporting_Tool). Although data on new cases is also available for 2020 and 2021, the COVID-19 pandemic affects these years and is not the focus of this article. We talk in this article about all cancers excluding non-melanoma skin cancer (all cancers exc NMSC), which is a standard grouping used in statistics about cancer.
- People living with or beyond cancer: Building on cancer registry data and calculations, Macmillan estimates that in 2025, about 190,000 people living in Wales will have had a cancer diagnosis at some point in their lives. Some are currently unwell, while others have had treatment and recovered.
- Deaths: In 2024, cancer caused 9,123 deaths among people living in Wales (Cancer_Reporting_Tool) – around 1 in 4 of all deaths. Cancer is the top cause of avoidable death, responsible for 2,455 avoidable deaths in 2023 (latest data).
- Economic impact: In 2022/23, NHS Wales spent about £719 million on cancers and tumours, or around 8% of its total budget. Cancer also affects the economy in other ways, such as when people are too sick to work and leave their jobs.
How is the impact of cancer changing over time?
New cases
More people in Wales are being diagnosed with cancer:
- Between 2017 and 2019, there were an average of 20,031 new cancer cases each year (Cancer_Reporting_Tool). That’s 3,511 more cancer cases each year compared to 2002 to 2004, or a 21% increase over 15 years.
- If current trends continue, we estimate there could be 24,371 cancer cases each year by 2035. That’s a projected 11% increase from 2025 to 2035.
- To see what this looks like, see Figure 1. For background on how to interpret projections, see Understanding projections.
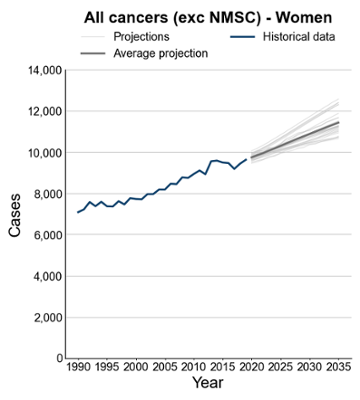
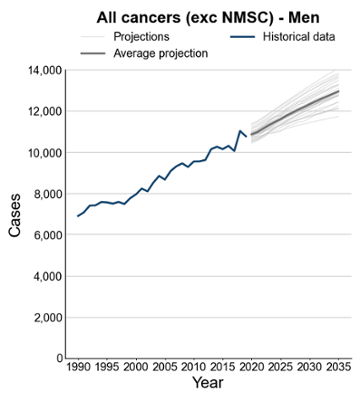
Figure 1 Observed (1990-2019) and projected (2020-2035) incidence count of all cancers excluding NMSC among people resident in Wales. Source: Based on cancer registration data (Welsh Cancer Intelligence and Surveillance Unit), mid year population estimates (Office for National Statistics, Population estimates for regions in England and Wales by sex and age; Historical time series, published July 2024), and population projections (Office for National Statistics, National population projections: 2022-based, Wales principal projection).
The impact of age
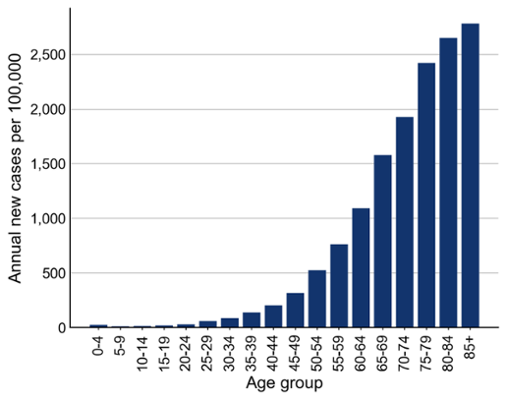
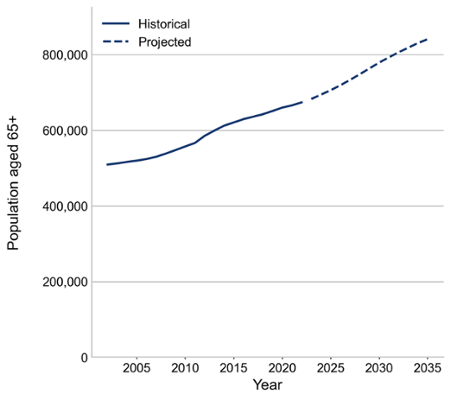
The likelihood of being diagnosed with cancer goes up as we get older (Figure 2). Therefore, as the number of older people in Wales goes up, we expect the number of new cancer cases to go up too. In the twenty years from 2005 to 2025, the number of people aged 65 and over is estimated to have grown by 186,000 people (36%; Figure 3). In the ten years from 2025 to 2035, this number is projected to grow by another 135,000 people (19%; Figure 3).
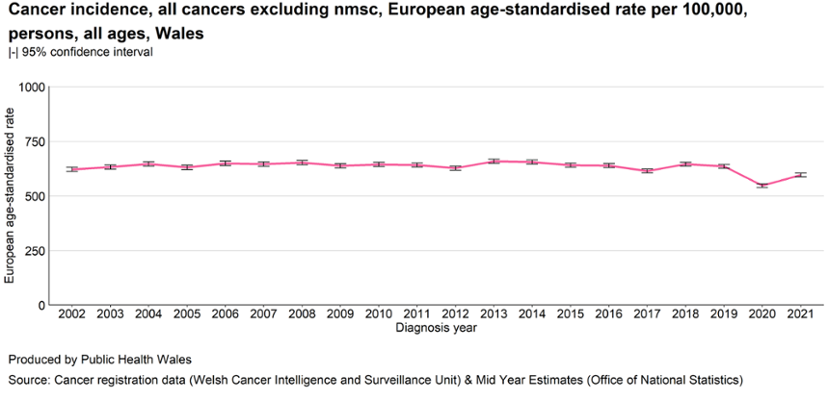
To help us compare over time, we use age-standardised rates. This means we’ve adjusted the numbers to take age into account. From 2002 to 2019, the overall age-standardised incidence rate of cancer in Wales stayed about the same (Figure 4).
Survival
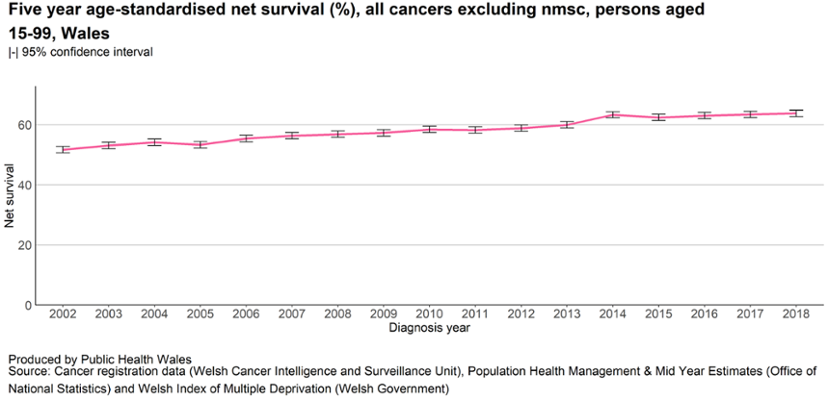
Between 2002 and 2018, the likelihood of surviving from cancer for 5 years or more after being diagnosed went up (Figure 5). When we talk about survival in this article, we mean age-standardised net survival. Net survival is an estimate of the likelihood of survival for adult cancer patients if cancer were the only possible cause of death, excluding other potential causes like other illnesses or accidents. This helps isolate the impact of cancer itself on survival. Age-standardising accounts for age in the calculation.
Deaths
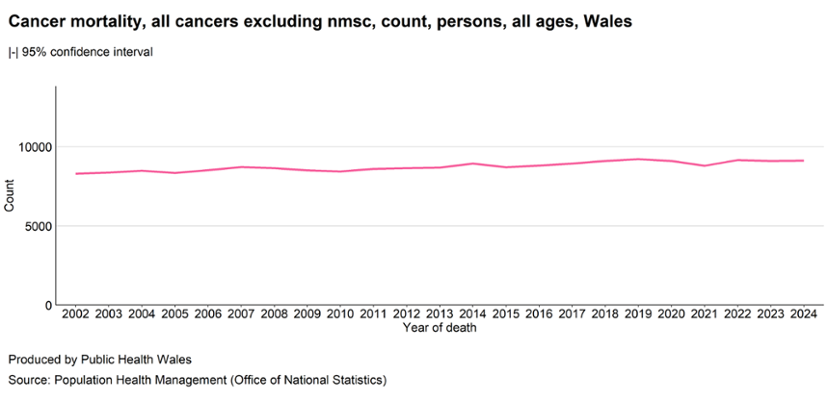
However, even as survival has gone up, the total number of people dying from cancer has still gone up as the total number of new cancer cases has gone up (Figure 6). In 2024, there were 9,123 deaths from cancer. That’s 828 (10%) more than in 2002.
The impact of deprivation
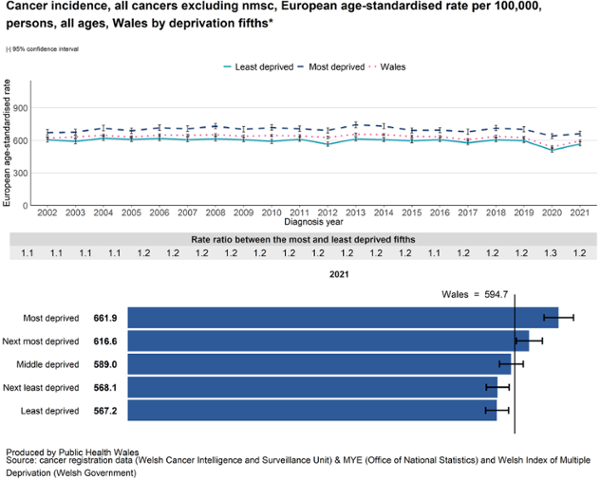
After taking age into account, people living in more deprived areas are more likely to get cancer than those in less deprived areas (Figure 7). They also have lower survival after diagnosis. These gaps have existed for a long time and show no sign of closing.
Cancer types
The four most common types of cancer in Wales are prostate cancer, breast cancer, lung cancer, and colorectal cancer (also called bowel cancer). These cancer types had between 2,500 and 3,100 new cases each in 2019. Together, they made up more than half of all new cancer cases in Wales (not including non-melanoma skin cancer).
Lung cancer is the leading cause of cancer death in Wales. In 2024, it caused 1,759 deaths, almost twice as many as the next most common cause. The cancers that caused more than 500 deaths in 2024 were lung cancer, colorectal cancer, cancer of unknown primary origin, prostate cancer, breast cancer, and pancreatic cancer.
Table 1 Number of deaths (2024) and number of cases (2019) for cancer types with over 500 deaths in 2024, by number of deaths. Number of cases is taken from 2019 as data from 2020 and 2021 is substantially affected by the COVID-19 pandemic. Source: Cancer Reporting Tool, based on cancer registration data (Welsh Cancer Intelligence and Surveillance Unit) and Population Health Management (Office for National Statistics).
| Cancer type | Number of deaths (2024) | Number of cases (2019) |
|---|---|---|
| Lung cancer | 1,759 | 2,560 |
| Colorectal (bowel) cancer | 987 | 2,532 |
|
Cancer of unknown primary origin This means the cancer has spread, but doctors can’t tell where it started. |
659 | 574 |
| Prostate cancer | 624 | 3,052 |
| Breast cancer |
590 (589 female breast) |
2,812 (2,793 female breast) |
| Pancreatic cancer | 555 | 573 |
There are different reasons why these cancers cause large numbers of deaths.
Lung cancer causes the most deaths because it is common and people diagnosed with it often don’t survive. One reason for this is because it is often diagnosed at a late stage. Doctors use “stage” to describe how big the cancer is and whether it has spread. Stage goes from 1 to 4, with stage 1 and 2 early stage and stage 3 and 4 late stage. People diagnosed with lung cancer at an early stage are much more likely to survive.
Colorectal cancer is also common, and while more people survive it than lung cancer, survival is lower than for other common cancers. That makes it the second most common cause of cancer death. Again, people are more likely to survive colorectal cancer when diagnosed at an earlier stage.
Prostate and breast cancer are also very common, but people with these cancers typically have a higher chance of surviving. One reason for this is that they’re often diagnosed at an early stage. However, because many people get these cancers, they still lead to a lot of deaths.
Pancreatic cancer is less common than the others, but it causes many deaths because people rarely survive it. Again, a key reason for this is that it is often diagnosed at late stage.
Cancer of unknown primary origin is included here for completeness, but it is important to note it is not one type of cancer. It describes cancers that have already spread, and doctors can’t find where they started. Because of this, it is harder to describe its usual pattern. Survival is typically low.
In this article, we’re going to look in more detail at four cancers that have both a high number of cases and a high number of deaths: lung cancer, colorectal cancer, prostate cancer and breast cancer.
Lung cancer
Lung cancer caused 1,759 deaths in 2024. That’s nearly 5 people every day. Lung cancer is common: between 2017 and 2019, an average of 2,528 people were diagnosed each year. After accounting for age, only 19% of people diagnosed between 2017 and 2021 survived their diagnosis by 5 years or more (age-standardised net survival). As for other cancers, people diagnosed at an early stage are much more likely to survive their diagnosis by 5 years or more (unstandardised 5 year net survival was 55% for people diagnosed with lung cancer at stage 1 compared to 3% for people diagnosed at Stage 4). Therefore, making sure lung cancer is diagnosed early is important. However, only 26% of lung cancers diagnosed in 2019 were diagnosed at stage 1 or 2. Lung cancer screening has been piloted in Wales, and its wider rollout has now been confirmed. Screening might help to find more lung cancers at an early stage.
Smoking is the biggest cause of lung cancer. In 2015, around 3 out of 4 lung cancer cases in Wales were estimated to be linked to smoking (Brown et al., 2018). This is because smoking greatly increases the risk of lung cancer – people who smoke are about 9 times more likely to get lung cancer than people who have never smoked (Brown et al., 2018) – and many people in Wales either smoke now or used to smoke. There are other risk factors for lung cancer too. These include breathing in harmful substances at work (like asbestos), local particulate air pollution, and ionising radiation (such as from radon gas found in some homes). All in all, risk factors that we can do something about were estimated to account for around 4 in 5 lung cancer cases in 2015 (Brown et al., 2018).
Because smoking is a big cause of lung cancer and patterns of smoking in the past were quite different for men and women, it is important to look at trends in lung cancer separately for men and women.
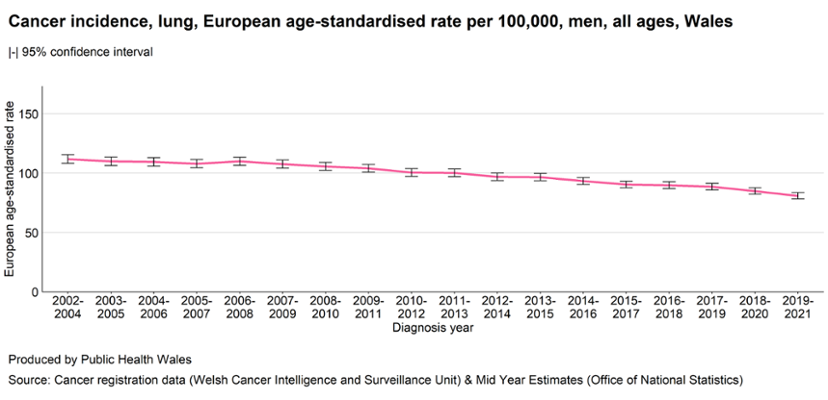
In men, the age-standardised rate of lung cancer went down between 2002-2004 and 2017-2019 (Figure 8; although the trend continues beyond 2019, we focus on years not affected by the COVID-19 pandemic). This probably reflects the fact that men alive in the 2010s had smoked less than earlier generations.
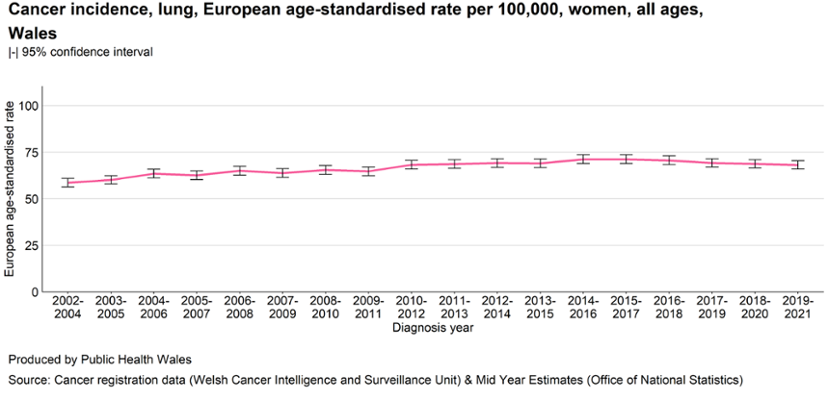
In women, the age-standardised rate of lung cancer went up overall over the same period (2002-2004 to 2017-2019), although it appears to be stabilising in recent years (Figure 9). The increase probably reflects the fact that older women alive in the mid-2010s had smoked more than earlier generations.
Like other cancers, people are more likely to get lung cancer as they get older. This means that even where age-standardised rates of lung cancer fall, the number of new diagnoses can stay stable or rise. This means that services treating lung cancer may need to see the same numbers, or greater numbers, of patients, even as people become less likely to develop lung cancer at a given age. Overall:
- 1,324 men were diagnosed with lung cancer each year on average between 2017 and 2019. That’s 36 (3%) more per year on average than between 2002 and 2004.
- 1,204 women were diagnosed with lung cancer each year on average between 2017 and 2019. That’s 325 (37%) more per year on average than between 2002 and 2004.
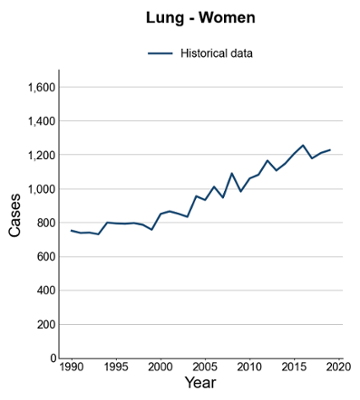
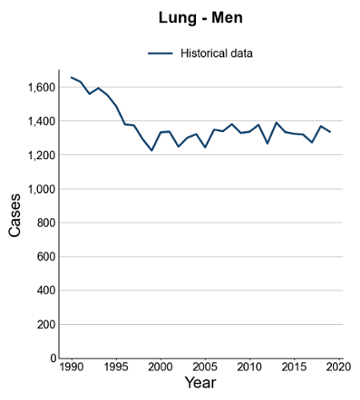
Figure 10 Observed (1990-2019) incidence count of lung cancer among women and men resident in Wales. Source: Based on cancer registration data (Welsh Cancer Intelligence and Surveillance Unit).
There is much uncertainty about future lung cancer. Because of this, we are not producing projections now, but are planning more detailed analysis. Historical patterns of smoking are an important influence on current and future lung cancer cases, but it is hard to model their impact. Another thing that is not yet clear is what the impact of rolling out lung cancer screening will be. Screening for lung cancer is recommended because it reduces deaths from lung cancer. It might also increase the number of cancers that are found.
Colorectal cancer (bowel cancer)
Colorectal cancer caused 987 deaths in 2024. Colorectal cancer is common: between 2017 and 2019, an average of 2,396 people were diagnosed each year. After accounting for age, 60% of people diagnosed between 2017 and 2021 survived their diagnosis by 5 years or more (age-standardised net survival), and the proportion who do so has gone up over time.
Looking at the overall number of cases:
- Between 2017 and 2019, there were 429 more colorectal cancer cases on average each year compared to 2002 to 2004. That’s a 22% increase.
- If current trends continue, we estimate there could be 2,832 colorectal cancer cases each year by 2035 (a projected 9% increase from 2025 to 2035).
- To see what this looks like, see Figure 11. For background on how to interpret projections, see Understanding projections.
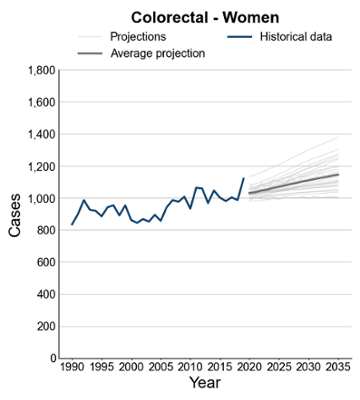
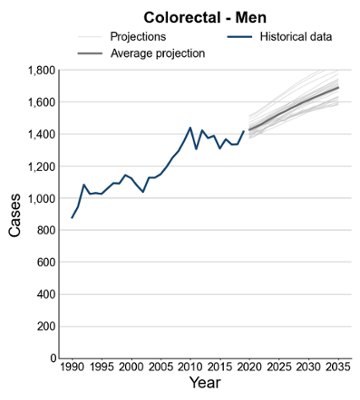
Figure 11 Observed (1990-2019) and projected (2020-2035) incidence count of colorectal cancer among women and men resident in Wales. Source: Based on cancer registration data (Welsh Cancer Intelligence and Surveillance Unit), mid year population estimates (Office for National Statistics, Population estimates for regions in England and Wales by sex and age; Historical time series, published July 2024), and population projections (Office for National Statistics, National population projections: 2022-based, Wales principal projection).
Much of this increase is because people in Wales are getting older. When we look at overall rates after accounting for age, there has been little change over the same period.
However, there is concern that colorectal cancer is becoming more common in younger adults. Between 2002 and 2019, the rate in people under 55 went up by more than a third. As colorectal cancer is still very rare in this age group, this hasn’t yet made much difference to the overall age-standardised rate.
In 2015, just over half of colorectal cancer cases were linked to risk factors that we can do something about (Brown et al., 2018). These risk factors include eating too little fibre, eating processed meat, living with overweight or obesity, smoking, drinking alcohol, and not doing enough physical activity.
Of people diagnosed in 2019, 39% were diagnosed at stage 1 or 2. The screening programme for colorectal cancer in Wales, called Bowel Screening Wales, is one way to find cancer earlier. People aged 50 to 74 years old who are registered with a doctor are sent a screening kit every two years. As well as finding cancer earlier, the screening programme can also find precancerous conditions. These are changes in the bowel that aren’t cancer yet, but could turn into cancer over time. By finding and removing these early changes, screening can help stop cancer from developing in the first place.
Prostate cancer
Prostate cancer caused 624 deaths in 2024. It is the most common cancer in men in Wales. Between 2017 and 2019, on average 3,043 men were diagnosed with prostate cancer each year.
Estimates suggest that 98% of men diagnosed with prostate cancer between 2017 and 2021 survived their cancer for at least 5 years, after accounting for age (age-standardised net survival). Although people are very likely to survive prostate cancer, this estimate is probably too high, as the method we use can overestimate survival if men who get diagnosed with prostate cancer are less likely than other similar men to die from other causes.
Looking at the overall number of cases:
- Between 2017 and 2019, there were 931 more prostate cancer cases each year compared to between 2002 and 2004. That’s a 44% increase.
- If current trends continue, we estimate there could be 4,244 prostate cancer cases each year by 2035 (a projected 18% increase from 2025 to 2035).
- To see what this looks like, see Figure 12. For background on how to interpret projections, see Understanding projections.
A couple of things are likely to have contributed to the rise in prostate cancer cases:
- Prostate cancer is much more common in older men, and the population is getting older.
- More awareness and testing for prostate cancer may mean more cases are detected. In particular, a blood test called the prostate-specific antigen (PSA) test became increasingly available in the 1990s and may have led to more cases being detected. This may include cases that might not have caused harm within a person’s lifetime. The evidence suggests that the increase in cases between 1990 and the mid 2000s was due to a combination of the population getting older and more use of PSA testing. From the mid 2000s, the evidence suggests the main driver of the rise has been the population getting older.
Changes to detection of prostate cancer are hard to account for in projections. This is one reason our projections using different methods produce a range of results.
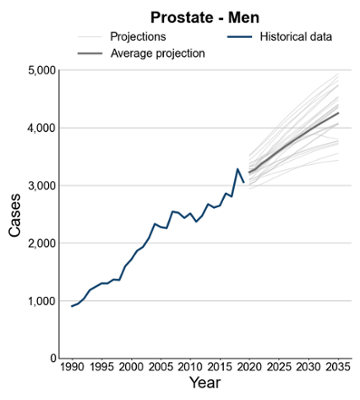
Unlike other cancers, there aren’t many known risk factors for prostate cancer that people can change (Brown et al., 2018).
Of men diagnosed in 2019, 55% were diagnosed at stage 1 or 2.
Screening for prostate cancer is not recommended in the UK (June 2025). This is because the test is not accurate enough to detect prostate cancers that need treatment, can falsely find men who do not have prostate cancer, and can miss some cancers. Sometimes men might have to undergo unnecessary and unpleasant tests and treatment. There is no clear answer about which treatment works best for men with early-stage prostate cancer. It is also not clear how PSA screening affects deaths due to prostate cancer.
Breast cancer in women
Men can get breast cancer, but it is rare compared to breast cancer in women. Therefore, in this article, we’ll focus on breast cancer in women.
Breast cancer in women caused 589 deaths in 2024. It is the most common cancer in women in Wales. Between 2017 and 2019, 2,793 women were diagnosed with breast cancer on average each year. Around 91% of women diagnosed between 2017 and 2021 survived their cancer by at least 5 years, after accounting for age (age-standardised net survival). This proportion has gone up over time.
Looking at the overall number of cases:
- Between 2017 and 2019, there were 384 more breast cancer cases in women each year on average compared to 2002 to 2004. That’s a 16% increase.
- If current trends continue, we estimate there could be 3,449 cases of breast cancer in women each year by 2035 (a projected 11% increase from 2025 to 2035).
- To see what this looks like, see Figure 13. For background on how to interpret projections, see Understanding projections.
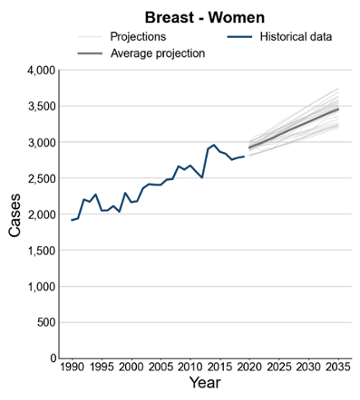
Much of this increase is because more people in Wales are getting older, and breast cancer is more common in older age. When we look at the rate after accounting for age, the change over time is much smaller, although it does appear to have gone up a little.
In 2015, nearly 1 in 4 breast cancer cases in women were linked to risk factors we can do something about (Brown et al., 2018). These include drinking alcohol, living with overweight or obesity, not breastfeeding, and using hormone replacement therapy (HRT).
Of women diagnosed in 2019, 72% were diagnosed at stage 1 or 2.
There is a screening programme in Wales called Breast Test Wales. It invites women aged 50 to 70 years to have a breast X-ray (called a mammogram) every three years. This test can find cancers before any symptoms appear. When breast cancer is found early through screening, treatment is more likely to work well and survival is better.
What opportunities are there to reduce the impact of cancer?
Tackling risk factors
In 2015, about 4 in 10 new cancer cases in Wales, or over 7,000 new cancer cases each year, were linked to risk factors that can be changed (Brown et al., 2018). Lung cancer, colorectal cancer, melanoma skin cancer, and breast cancer together accounted for over three fifths of potentially preventable cancer cases (Brown et al., 2018). Some of the most important risk factors for cancer are:
- Smoking
- Living with overweight or obesity
- Getting too much ultraviolet (UV) radiation (from the sun or sunbeds)
- Being exposed to harmful substances at work (like asbestos)
- Certain infections (like HPV)
- Drinking alcohol
- Eating too little fibre
- Being exposed to ionising radiation
- Eating processed meat
Different cancers have different risk factors: some of these are only a risk factor for certain cancer types, while others are a risk factor for many different types of cancer (Brown et al., 2018). Some of these risk factors have become less common over time, such as smoking. Others, like living with overweight or obesity, have become more common. For more information on trends in key risk factors for several diseases, see this recent article.
What are we doing to reduce the impact of cancer?
The health system is working to:
- Prevent cancer
- Ensure timely diagnosis
- Make sure people get effective and timely treatment
To learn more about what is being done to tackle key risk factors for a range of diseases (like smoking, living with overweight or obesity, poor diet, alcohol, air pollution, and low physical activity), see the recent article “A summary of trends in risk factors for non-communicable diseases” (A summary of trends in risk factors for non-communicable diseases – Public Health Wales). For example, work includes:
- Programmes, such as the Whole Systems Approach for a Healthy Weight, the children’s nutrition and healthy weight programme, PIPYN (the children and family early preventive intervention pilot programme for healthy weight), school food, the All-Wales Diabetes Prevention Programme, Help Me Quit in Hospital, Reducing Smoking in Pregnancy and JustB (a smoking prevention programme in schools).
- Services, including Help Me Quit and the National Exercise Referral Scheme.
- Legislation, including the Tobacco and Vapes Bill, the Tobacco Control Programme, legislation banning disposable vapes, legislation to restrict the placement and price promotion of products high in fat, sugar and salt, and minimum pricing for alcohol.
There is also work to tackle risk factors specific to cancer. For example, the HPV vaccine lowers the risk of cervical cancer and some other cancers. Environmental public health works to minimise exposure to, and ill health from, environmental hazards.
Screening programmes for some cancers are available. Screening can find cancer early, when treatment is more likely to work. Some screening programmes can also stop cancer before it starts by finding and treating early changes. Public Health Wales runs screening programmes in Wales for several cancer types:
- Breast Test Wales for breast cancer in women
- Bowel Screening Wales for colorectal (bowel) cancer
- Cervical Screening Wales for cervical cancer
- A targeted screening programme for lung cancer is being developed.
It’s also important for people to get diagnosed and treated in a timely way. The Welsh Government says that 75% of people should start their first full treatment within 62 days of when cancer was first suspected. But in March 2025, only 64% of people starting treatment were doing so within that time.
Finding out more
Other sources of information
If you or someone you know is living with cancer, you can find more information on the NHS 111 Wales site (NHS 111 Wales – Health A-Z : Cancer).
For more detailed statistics on cancer in Wales, including detailed information on cancer types not covered in this article, see the Cancer Reporting Tool (Cancer Reporting Tool). Wider information related to cancer registration in Wales can be found on the Welsh Cancer Intelligence and Surveillance Unit page (Welsh Cancer Intelligence and Surveillance Unit (WCISU) – Public Health Wales).
To find out more about inequalities in cancer incidence, beyond those covered within the Cancer Reporting Tool, see the report “Inequalities in cancer incidence in Wales by socio-demographic characteristics, 2011-2020” (published June 2025, Inequalities in cancer incidence in Wales by socio-demographic characteristics, 2011-2020 – Public Health Wales).
To find out more about risk factors:
- More information on risk factors for several non-communicable diseases can be found in the recent article “A summary of trends in risk factors for non-communicable diseases” (A summary of trends in risk factors for non-communicable diseases – Public Health Wales).
- More information on environmental risk factors (such as air quality, radiation, sun safety and asbestos) can be found on the page for Environmental Public Health on the Public Health Wales website (Environmental Public Health – Public Health Wales).
- More information on HPV vaccination can be found on the topic page for the HPV vaccine on the Public Health Wales website (HPV vaccine – Public Health Wales).
To find out more about cancer screening in Wales, see:
- Breast Test Wales
- Bowel Screening Wales
- Cervical Screening Wales
- Lung cancer screening (in development)
To find out more about the care of cancer patients in Wales, see:
- The NHS Wales National Cancer Team works to improve outcomes and care for cancer patients in Wales.
- Audit Wales published a report on Cancer Services in Wales in January 2025.
We welcome feedback and discussion of this article. Please get in touch by emailing: [email protected]
What does this mean for my area?
All the information in this article is about the whole of Wales.
Using the Cancer Reporting Tool (Cancer Reporting Tool), you can find many of the charts and numbers discussed at Health Board and local authority level. Projections are not currently available at lower level than Wales.
We expect most of the patterns we talk about to apply to most areas in Wales. One thing that differs between areas is what the population looks like in terms of age and deprivation. These differences might mean we see a different number of cancers and different patterns over time. But mostly, we expect the trends to be more similar than different.
If you would like more support with applying this information in your area, please get in touch by emailing: [email protected]
Methods
Understanding the data used in this article
This report was prepared using:
- Population estimates and projections: Population estimates and projections for Wales were taken from the Office for National Statistics.
- Cancer data: Cancer data is maintained by the Wales Cancer Intelligence and Surveillance Unit at Public Health Wales. Detailed information on cancer registration and reporting can be found in the Technical Guide to the Cancer Reporting Tool.
Understanding projections
Projections help us understand what might happen in the future if past trends continue. However, they are not exact. The further into the future we look, the more uncertain we are. Things like new health policies or changes in behaviour could change the pattern of cancer cases.
For all cancers excluding NMSC and for each cancer type, we used several different methods to project how many cases there might be in the future. The methods included:
- Different algorithms, such as ARIMA, Prophet, and one where the current age-specific rates of cancer were carried forward.
- Some methods predicted the number of cases directly, while others predicted cancer rates and then multiplied these by the future population.
- Some looked at the whole population, while others looked at different age groups separately.
- Some used different end years for the data to avoid potential problems caused by delays in cancer case registrations (1988-2017, 1989-2018 and 1990-2019).
To get our main (or central) projection, we then took an average of the results. Using a mix of methods and taking the average of them makes the projections more robust overall. Looking at how different methods compare can also show us how much the results depend on the choices and assumptions made.
Even though data on cancer cases were available up to 2021, we used 2019 as the starting point for the projections. Cancer data from 2020 and 2021 were affected by the COVID-19 pandemic, which makes them less helpful for spotting long-term trends.
Different organisations, such as Cancer Research UK, have also published cancer projections (note that the main page focusses on age-standardised rates, rather than the overall number of cases). Findings on major trends are generally consistent, although some differences will be expected when using data from different time periods, areas and projection methodologies.
More detailed information on methods used in this article is available on request. Please contact us by emailing: [email protected]
Data files
Official statistics on cancer incidence, cancer survival, and cancer mortality can be accessed via the Cancer Reporting Tool (Cancer Reporting Tool) and the Welsh Cancer Intelligence and Surveillance Unit page (Welsh Cancer Intelligence and Surveillance Unit (WCISU) – Public Health Wales). This data also includes breakdowns and cancer types not covered in this article. Small differences with the numbers in this article may be expected as historical data in the Cancer Reporting Tool is updated when a new release is made.
Data associated with new analyses done for this article can be downloaded as:
We are aware that there can be issues downloading the data files in Microsoft Edge. If you would like the data, you may need to use a different browser, use ‘Save as’ if the data opens in an online tab or contact us at: [email protected].
About this article
This article was prepared by Rosemary Walmsley, Leon May, Serenay Ozalp, Jonathan Rees, Ffion Thomas, Rebecca Thomas, Dyfed Wyn Huws, Louisa Nolan and Llion Davies.
To contact us, please email: [email protected]
We would like to thank Anthony Davies (Welsh Government) for feedback on this article and Katrina Brown and Sam Finnegan (Cancer Research UK) for sharing information about their work.
References
Brown, K.F., Rumgay, H., Dunlop, C. et al. The fraction of cancer attributable to modifiable risk factors in England, Wales, Scotland, Northern Ireland, and the United Kingdom in 2015. Br J Cancer 118, 1130–1141 (2018). https://doi.org/10.1038/s41416-018-0029-6
Related reports
-
Cancer mortality in Wales
Next update: To be announced (2027) Contact for queries or feedback Introduction This publication reports on deaths registered between 2002 and 2025 with outputs presented by single and three-year rolling […]
Published on: 15th July 2026
-
Why are cases of non-melanoma skin cancer increasing in Wales: an agile scope of the literature
Next update: Update not planned Contact for queries and feedback Introduction Non-melanoma skin cancers (NMSC) are the most common type of cancer in Wales, making up 94% of all skin […]
Published on: 1st July 2024
-
Public Health Outcomes Framework Reporting Tool
Current release: 17th June 2026Next release: 22nd September 2026 Contact for queries or feedback Introduction Main points In this iteration, the following indicators have been updated: The following table details […]
Published on: 17th June 2026
-
A rapid review exploring the effectiveness of artificial intelligence for cancer diagnosis
This rapid review was conducted as part of the Evidence Service’s collaboration with Heath and Care Research Wales Next update: Update not planned Contact for queries and feedback Introduction In […]
Published on: 1st November 2023
-
Macmillan-WCISU partnership including cancer incidence, prevalence and comorbidities
Contact for queries or feedback Introduction Macmillan Cancer Support and the Welsh Cancer Intelligence and Surveillance Unit of Public Health Wales entered into a partnership in April 2017. The aim is to deliver […]
Published on: 27th March 2019
-
Non-melanoma skin cancer incidence in Wales
Next update: To be announced Contact for queries or feedback Introduction This is the most recent Official Statistics publication for non-melanoma skin cancer (NMSC) incidence in Wales. Statistics are available by cancer […]
Published on: 30th May 2024
Related data
-
Cancer mortality in Wales data
Last reviewed: 15th July 2026
-
Cancer in Wales – trends and projections: data tables
Last reviewed:
-
Inequalities in cancer incidence in Wales by socio-demographic characteristics, 2011-2020 data
Last reviewed: 5th June 2025
-
Cancer incidence and prevalence for Cluster Networks in Wales data
Last reviewed: 12th July 2018
-
Non-melanoma skin cancer incidence in Wales data
Last reviewed: 30th May 2024