

Cancer mortality in Wales
Authors: Analysis Team, Welsh Cancer Intelligence and Surveillance Unit
Published on: 15th July 2026
Next update: To be announced (2027)
Contact for queries or feedback
Introduction
This publication reports on deaths registered between 2002 and 2025 with outputs presented by single and three-year rolling periods for men, women and persons for Wales, health boards, local authorities and area deprivation fifths.
Main points
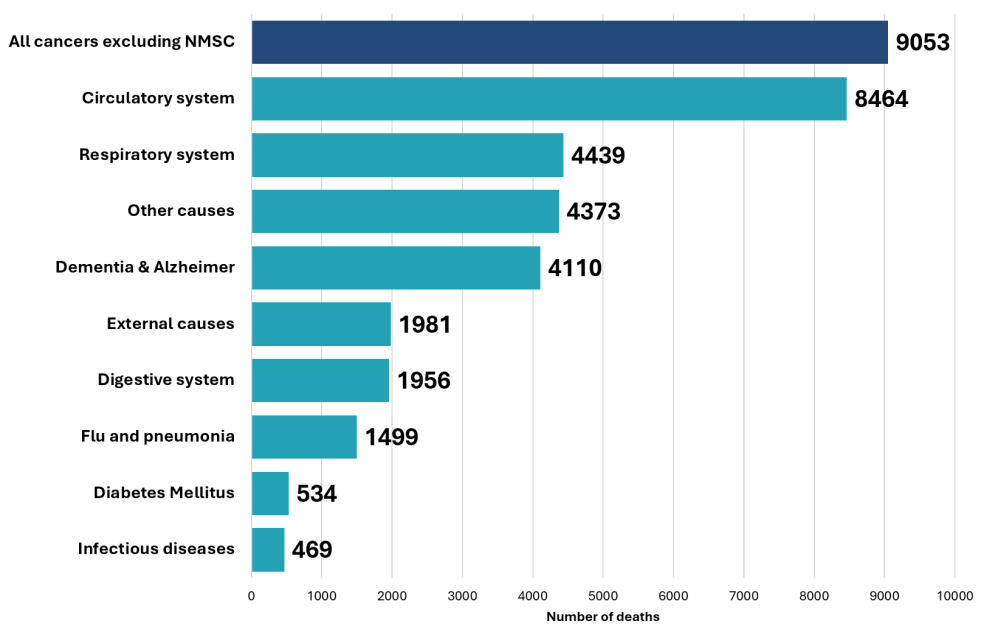
Cancer is still the leading cause of death in Wales. In 2025, there were 9,053 deaths from cancer, accounting for over a quarter of all deaths (Figure 1).
Figure 1: Number of cancer deaths compared to other causes of death in Wales in 2025
Mortality by broad cause group, count, persons, all ages, Wales, 2025
Produced by Public Health Wales, using Public Health Mortality (PHM) from the Office for National Statistics (ONS)
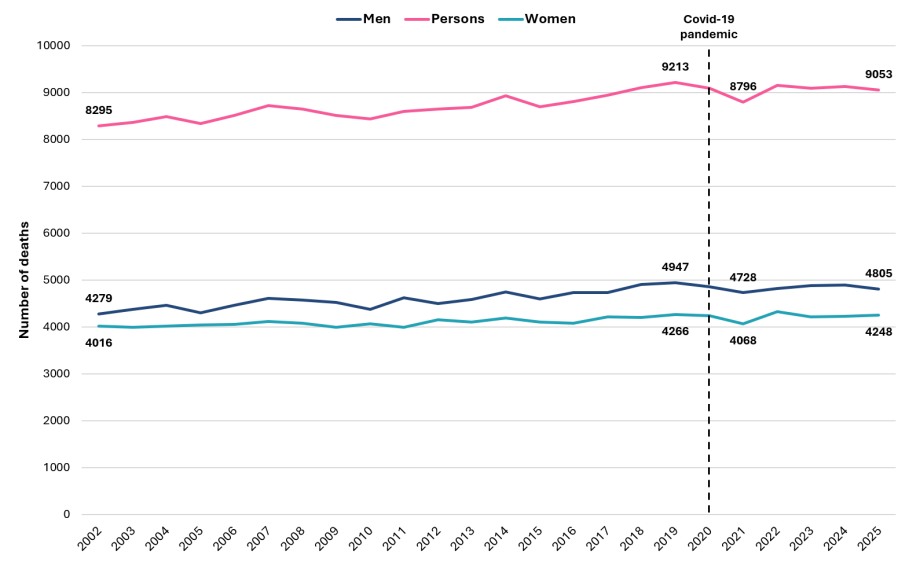
The number of cancer deaths was slowly rising for years before the pandemic, mainly due to an ageing population (Figure 2).
It is still too early to fully understand the impact of the pandemic. The number of annual cancer deaths stopped rising, with slightly fewer cancer deaths in 2025 than both 2024 and pre-pandemic levels (Figure 2). It is not yet clear if this will continue.
Figure 2: Trends in the number of cancer deaths of men, women and persons in Wales
Cancer mortality by sex, count, all cancers excluding non-melanoma skin cancer (NMSC), all ages, Wales, 2002-2025
Produced by Public Health Wales, using PHM from ONS
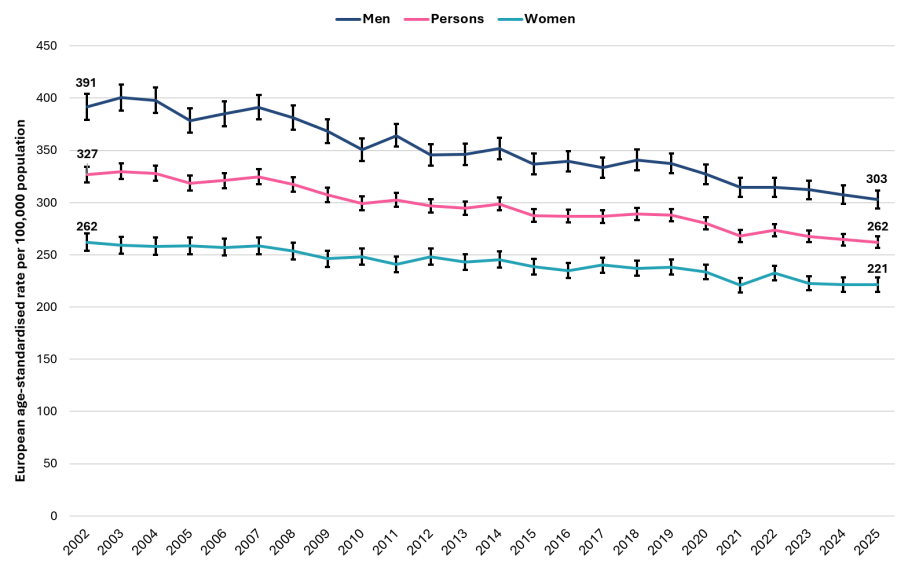
But when we take changes in population size, age and sex structure into account, cancer death rates had fallen in men and stayed about the same in women, particularly following the pandemic (Figure 3).
Figure 3: Trends in cancer death rates of men, women and persons in Wales
Cancer mortality by sex, European age-standardised rate, all cancers excluding NMSC, all ages, Wales, 2002-2025
Produced by Public Health Wales, using PHM and Mid-Year Estimates (MYE) from ONS
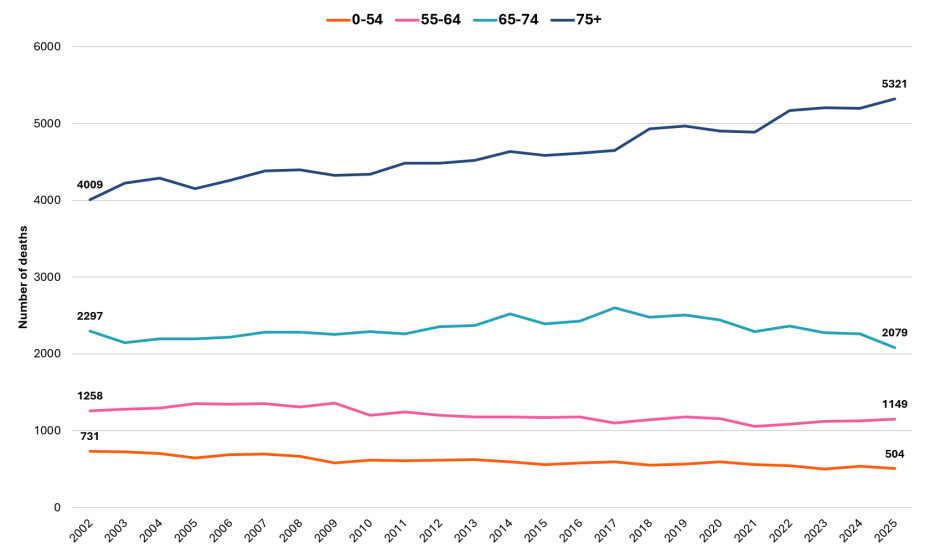
Nearly 6 in 10 (59%) cancer deaths were in people aged 75 and over in 2025. This increased from nearly 5 in 10 (48%) in 2002, reflecting the ageing population (Figure 4).
Figure 4: Trends in the number of cancer deaths in different age groups in Wales
Cancer mortality by age group, count, all cancers excluding NMSC, persons, Wales, 2002-2025
Produced by Public Health Wales, using PHM from ONS
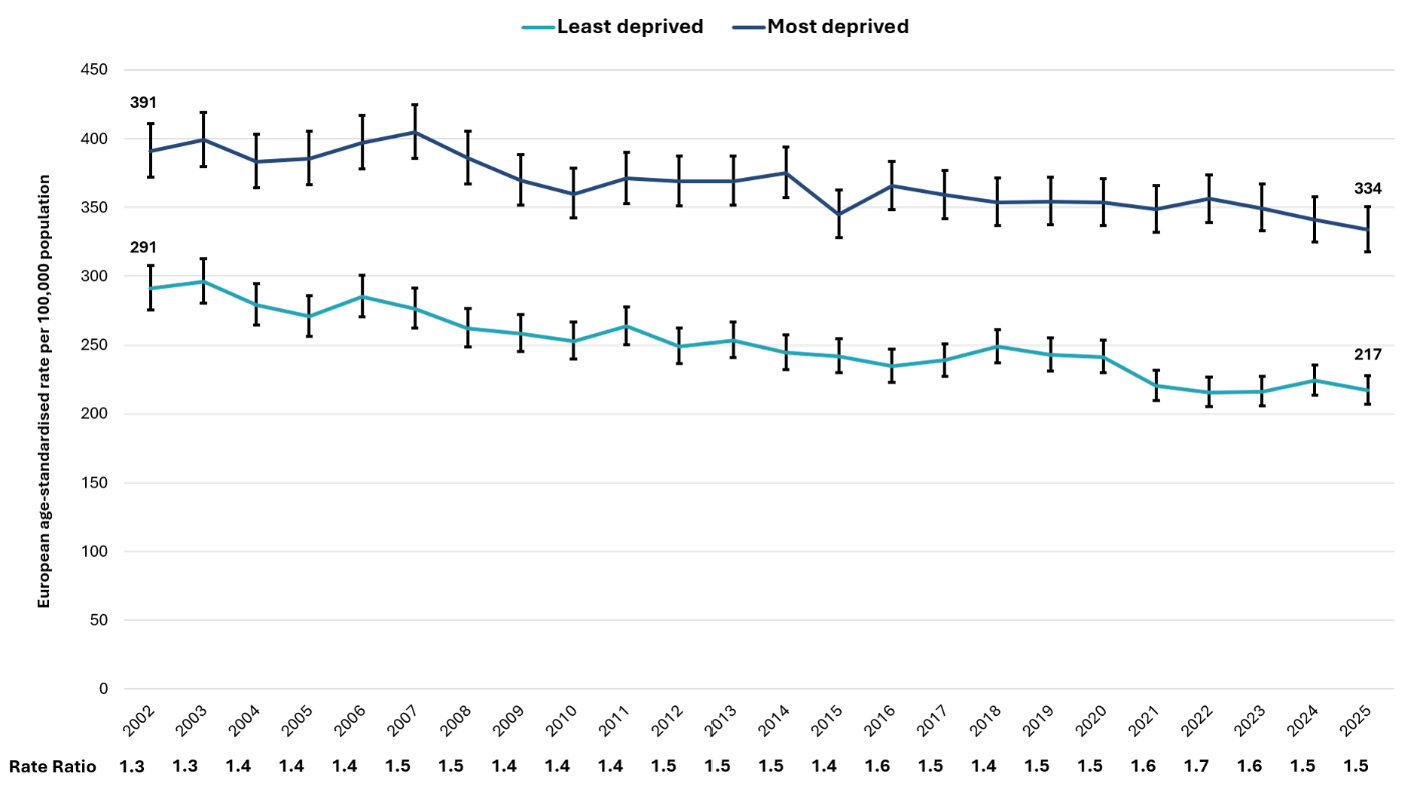
People in the most deprived areas have higher death rates from cancer. In 2025, death rates were one-and-a-half times (54%) higher than in the least deprived areas. This gap has shown little change over time (Figure 5).
Figure 5: Trends in cancer death rates in Wales by area deprivation fifth
Cancer mortality by deprivation fifth, European age-standardised rate, all cancers excluding NMSC, persons, all ages, Wales, 2002-2025
Produced by Public Health Wales, using PHM and MYE from ONS and Welsh Index of Multiple Deprivation (WIMD) from Welsh Government
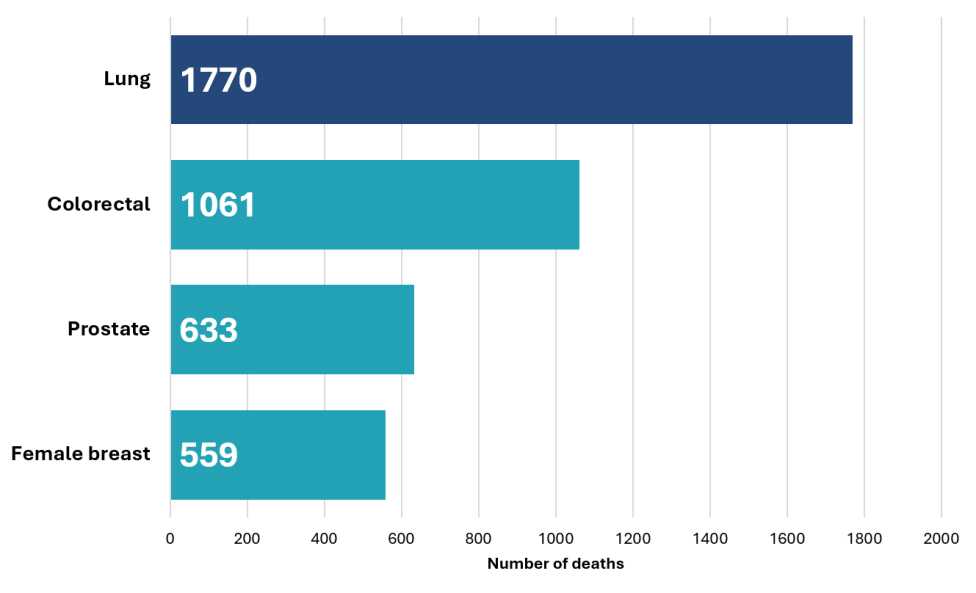
Four main types of cancer – lung, bowel, prostate and female breast – caused 4 in every 10 (44%) cancer deaths. Most deaths for each type occurred in people aged 75 and over. Lung cancer is the main cause, responsible for 2 in every 10 (20%) cancer deaths. Next was bowel (colorectal) cancer (Figure 6).
Figure 6: Number of cancer deaths in Wales by top cancer types in 2025
Cancer mortality by cancer type, count, persons, all ages, Wales, 2025
Produced by Public Health Wales, using PHM from ONS
Data tables
Access the data related to this report
Technical information
Access the cancer reporting tool technical guide
Pre-release list
Dr Tracey Cooper, NHS Wales Cancer Board Chair and Chief Executive of Public Health Wales
Professor Tom Crosby, National Cancer Clinical Director for Wales
Anthony Davies, Senior Policy Manager, Value Based Healthcare Policy Team, Welsh Government
Related reports
-
Public Health Outcomes Framework Reporting Tool
Current release: 22nd September 2026Next release: 15th December 2026 Contact for queries or feedback Introduction Main points In the latest iteration, the following indicators have been updated to include breakdowns […]
Published on: 22nd September 2026
-
Why are cases of non-melanoma skin cancer increasing in Wales: an agile scope of the literature
Next update: Update not planned Contact for queries and feedback Introduction Non-melanoma skin cancers (NMSC) are the most common type of cancer in Wales, making up 94% of all skin […]
Published on: 1st July 2024
-
Cancer in Wales – trends and projections
Purpose This article is about the past, current, and future impact of cancer in Wales. It includes: Headlines Cancer in Wales – impact and trends What impact does cancer have […]
Published on: 2nd September 2025
-
A rapid review exploring the effectiveness of artificial intelligence for cancer diagnosis
This rapid review was conducted as part of the Evidence Service’s collaboration with Heath and Care Research Wales Next update: Update not planned Contact for queries and feedback Introduction In […]
Published on: 1st November 2023
-
Macmillan-WCISU partnership including cancer incidence, prevalence and comorbidities
Contact for queries or feedback Introduction Macmillan Cancer Support and the Welsh Cancer Intelligence and Surveillance Unit of Public Health Wales entered into a partnership in April 2017. The aim is to deliver […]
Published on: 27th March 2019
-
Non-melanoma skin cancer incidence in Wales
Next update: To be announced Contact for queries or feedback Introduction This is the most recent Official Statistics publication for non-melanoma skin cancer (NMSC) incidence in Wales. Statistics are available by cancer […]
Published on: 30th May 2024
Related data
-
Cancer mortality in Wales data
Last reviewed: 15th July 2026
-
Cancer in Wales – trends and projections: data tables
Last reviewed:
-
Inequalities in cancer incidence in Wales by socio-demographic characteristics, 2011-2020 data
Last reviewed: 5th June 2025
-
Cancer incidence and prevalence for Cluster Networks in Wales data
Last reviewed: 12th July 2018
-
Non-melanoma skin cancer incidence in Wales data
Last reviewed: 30th May 2024