Respiratory disease prevalence – trends, risk factors, and 10-year projections
Author: Rhys Powell, Publichealthwalesobservatory@wales.nhs.uk
Many thanks for providing additional evidence and comments to: Clare Withey, Scott Wright, Llion Davies, Louisa Nolan, Nathan Lester, Rhian Hughes, Sarah Jones, Paul Callow, Huw Brunt, Amber Horton, Sian Evans, Anthony Gibson, Malorie Perry
Date published: 19 June 2025
1. Purpose
The focus of this article is on respiratory disease. It includes:
-
New projections of respiratory disease to 2033/34
-
Discussion of the risk factors driving these projections
-
The impact of respiratory disease on the NHS
-
A summary of the activities of the health system to address respiratory disease prevalence and health outcomes.
This article is the fifth in our series looking at trends and projections for some of the most prevalent non-communicable diseases in Wales.
Respiratory disease covers a range of conditions affecting the airways and other structures of the lungs. This article covers the respiratory diseases and risk factors for which we have data, including exploring potential inequalities where possible. For some aspects of respiratory disease, data was not available for our analysis. The article also lists some of the services, programmes, prevention services and legislation that tackles respiratory disease in Wales.
We anticipate that this series of articles will be useful to decision-makers, those interested in prevention, planners, and indeed anyone who is interested in future projections of disease, and their underlying risk factors.
All data from this article together with some additional breakdowns can be downloaded.
The articles in the series include:
-
A summary of prevalence of non-communicable disease and cancer incidence in Wales trends and 10-year projections (December 2024)
-
Respiratory disease prevalence – trends, risk factors, and 10-year projections
-
Musculoskeletal disease (not yet available)
-
Cancer (not yet available)
-
Smoking scenarios (not yet available)
-
Mental health (not yet available)
2. Headlines
-
Based on historic GP practice register data, if current trends continue the number of patients on asthma and Chronic Obstructive Pulmonary Disease (COPD) registers is projected to increase over the next 10 years. Asthma is projected to increase to over 256,000 registered cases and COPD to over 84,000 (Quality and Outcomes Framework, 2009/10 to 2018/19, and the Quality Assurance and Improvement Framework, 2019/20 to 2023/24, Welsh Government).
-
Between 2009/10 and 2023/24, the number of patients on the GP held asthma register increased from roughly 211,000 to 237,400, an increase of 13%. The numbers had been increasing prior to COVID-19, during which it decreased, but remains higher than pre-pandemic (Quality and Outcomes Framework, 2009/10 to 2018/19, and the Quality Assurance and Improvement Framework, 2019/20 to 2023/24, Welsh Government).
-
In the same period, the number of patients on the GP held COPD register increased from roughly 62,700 to 75,600, an increase of 21%. The number had been increasing prior to COVID-19, during which it decreased, but remains higher than pre-pandemic (Quality and Outcomes Framework, 2009/10 to 2018/19, and the Quality Assurance and Improvement Framework, 2019/20 to 2023/24, Welsh Government).
-
Those residing in the Welsh Index of Multiple Deprivation (WIMD) most deprived fifth are more than twice as likely to die from a respiratory disease compared with those residing in the least deprived fifth. In 2023, the age-standardised mortality rate in the most deprived WIMD fifth was 203 per 100,000 compared to 91 per 100,000 in the least (Public Health Mortality, Mid-Year Population Estimates, Office for National Statistics).
-
Chronic lower respiratory diseases (ICD-10 codes J40-J47) and influenza and pneumonia (ICD-10 codes J09-J18) were the underlying cause for 3,666 deaths in Wales in 2023. This compares to 3,796 deaths attributed to dementia and Alzheimer’s disease, the leading cause of death (Deaths registered in England and Wales, 2014 - 2023, ONS).
3. Contents
8.3 Inhalers decarbonisation strategy
9.1 Respiratory disease immunisation programme summary
10.1.2 Indoor air pollution and environmental hazards
10.3 Wider determinants - deprivation
11. An overview of services, programmes, prevention services and legislation in Wales
11.1 Strategies and Legislation
12. Data quality and interpretation
12.4 Patient Episode Database Wales
12.5 Self-reported survey data
12.7 National Survey for Wales
12.9 Housing, Health and Safety Rating System (HHSRS)
13.1 Download the data in this article – Excel
13.2 Download the data from this article with additional breakdowns - CSV
13.3 Download risk factor data with additional breakdowns - CSV
4. Overview
Respiratory disease prevalence has remained stable over time, however, the number of people reported to be diagnosed with respiratory diseases has increased since 2009/10. If this trend continues the number of patients on GP held registers is projected to increase further by 2033/34. In 2023/24, roughly 237,400 people and 75,600 people were registered as having asthma and Chronic Obstructive Pulmonary Disease respectively. This is projected to increase to 256,400 and 84,800 respectively by 2033/34 (Quality and Outcomes Framework, 2009/10 - 2018/19, Quality Assurance and Improvement Framework, 2019/20 – 2023/24, Welsh Government).
There has historically been, and remains, a gap between the most and least deprived Welsh Index of Multiple Deprivation (WIMD) fifths in Wales. Persons from the most deprived fifths experience higher rates of emergency admissions due to respiratory diseases. Prior to the COVID-19 pandemic, in 2019/20 there were 2,514 per 100,000 admissions in the most deprived fifth, compared to 1,422 per 100,000 in the least deprived.
Those residing in the most deprived fifth are more than twice as likely to die from a respiratory disease compared with those residing in the least deprived fifth. In 2023, the age-standardised mortality rate in the most deprived fifth was 203 per 100,000 compared to 91 per 100,000 in the least (Public Health Mortality, Mid-Year Population Estimates, Office for National Statistics).
Two of a number of risk factors for respiratory disease are smoking and air pollution. As highlighted in our risk factors article, the numbers of people experiencing unhealthy behaviours such as living with obesity and physical inactivity, have been increasing. Although, the prevalence of smoking has decreased. The UK is recognised as having one of the most comprehensive tobacco control policies in the world (Cairney, 2019). UK legislation has included banning smoking in enclosed public places and workplaces, sales of tobacco to under 18s and mandating plain packaging for tobacco products. These have all contributed to the decline in smoking prevalence. The Welsh Government has introduced legislation aimed at tackling air pollution, the Environment Air Quality & Soundscapes Act 2024. This sets out commitments to raise awareness of the health effects caused by air pollution. It also commits to reducing air pollution. It complements the Clean Air Plan for Wales, which as well as tackling air pollution, looks at ways to enable and encourage active travel. It is important to be mindful of indoor air pollution as well. Indoor air pollution can come from a number of sources, including wood or coal burning heaters and chemicals from cleaning sprays.
5. Prevalence & projections
5.1 Historic prevalence
Prevalence is a measure that looks at how many known cases of a disease are in the population at any given point. Our analysis utilises counts and prevalence rates. An increase in counts does not necessarily mean an increase in prevalence rates as the total population may also increase. However, counts are useful as they show us the potential impact on the system, for example, the number of patients requiring emergency admission to hospital. Furthermore, counts are the most consistent data measure available to us over a long enough period to allow projections to be calculated. Prevalence rates represent the true prevalence since they take into account the population size and show if the situation is getting proportionally worse.
Counts are available from 2009/10 via the Quality and Outcomes Framework and to 2019/20 via the Quality and Improvement Framework. Prevalence rates are only available from 2019/20 via the Quality and Improvement Framework. Some age-standardised analyses is available in our Primary Care Clusters dashboard.
As shown in our prevalence and projections article, the number of people on the respiratory asthma and Chronic Obstructive Pulmonary Disease (COPD) disease registers held at GP practices in Wales have increased over the last 13 years (Table 1). An increase is expected due to the ageing population, improved detection and increasing population size in general. Both asthma and COPD registers saw a decrease in count between 2020 and 2021 (Figure 1), before increasing in the following years. Access to spirometry, a vital lung function test used in the diagnosis and managment of conditions such as COPD and asthma, has been variable across Wales for many years (Welsh Government, 2024). This inconsistent availability, particularly post-pandemic where services were impacted (Life Sciences Hub Wales, 2022) may influence the accuracy of diagnosis for new cases added to the register.
Number of patients on GP held respiratory disease related registers, change from 2009/10 to 2023/24
| Condition | Count in 2009/10 | Count in 2023/24 | Percentage increase |
|---|---|---|---|
| Asthma | 211,000 | 237,400 | 13% |
| COPD | 62,700 | 75,600 | 21% |
Table 1: The number of patients on GP held respiratory disease registers has increased over time. An increase is expected due to the ageing population and improved detection. Percentages have been rounded to the nearest whole number and counts to the nearest hundred. (Quality and Outcomes Framework, 2009/10 to 2018/19, and the Quality Assurance and Improvement Framework, 2019/20 to 2023/24, Welsh Government).
Observed (2009/10 to 2023/24) and projected (2024/25 to 2033/34) asthma and COPD GP held register patients, count
Asthma

COPD
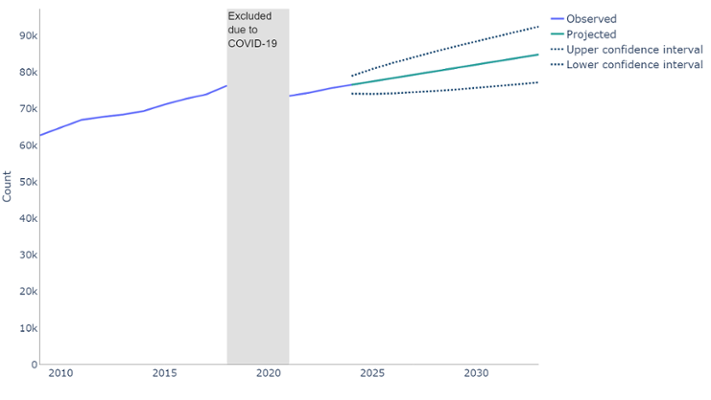
Figure 1: If current trends continue, the number of people on GP held registers with asthma or COPD will continue to increase. However, the reduced prevalence of smoking, de-industrialisation of Wales and introduction of more stringent workplace health legislation will influence COPD prevalence over time. Time series forecast (ARIMA model) trained on the observed counts. (Quality and Outcomes Framework, 2009/10 to 2018/19, and the Quality Assurance and Improvement Framework, 2019/20 to 2023/24, Welsh Government).
Table 2 shows the prevalence (rate per 100,000 population) of respiratory disease on GP held registers. These have slightly decreased between 2019/20 and 2023/24. (Quality Assurance and Improvement Framework, 2019/20 to 2023/24, Welsh Government).
GP held respiratory disease registers prevalence rate change, 2019/20 to 2023/24
| Condition | Prevalence percentage in 2019/20 | Prevalence percentage in 2023/24 |
|---|---|---|
| Asthma | 7.4% | 7.2% |
| COPD | 2.4% | 2.3% |
Table 2: The prevalence rate has remained stable since 2019/20. As this is looking at the percentage of the population affected, and not just how many patients, this indicates prevalence has remained stable (Quality and Outcomes Framework, 2009/10 to 2018/19, and the Quality Assurance and Improvement Framework, 2019/20 to 2023/24, Welsh Government).
When interpreting GP register data, it is important to note that changes to policy and healthcare developments may have an impact, such as incentives for identifying certain diseases or improved disease detection respectively. Therefore, an increase in register prevalence rate may reflect a change in data collection rather than an actual change in population prevalence rate. Registers are likely to report an undercount of the true population prevalence because in the real world every single case of disease will not be recorded. When the Quality Assurance and Improvement Framework replaced the Quality and Outcomes Framework in 2019/20, the change in contract for data collection from primary care potentially led to changes in data quality. Specifically, under counting data due to poorer-quality coding (Davies et al., 2025).
5.2 Projections
We have projected the GP held register data forward 10 years, from our latest data point in April 2024, to estimate the counts in 2033/34. We do not expect these projections to be precise, rather, they show a likely direction of travel should nothing else change in between. For example, introduction of a policy or legislative intervention such as the legislation to reduce smoking through bans on smoking in enclosed public places and workplaces, sales of tobacco to under 18s and mandating plain packaging for tobacco products, may change the actual prevalence trajectory away from the projected trajectory. More information on the method is available in section 12, or you can contact us via Publichealthwalesobservatory@wales.nhs.uk.
Projected change of the number of patients on select GP held respiratory disease registers 2023/24 to 2033/34
| Condition | Projected count in 2033/34 | Percentage increase |
|---|---|---|
| Asthma | 7.4% | 7.2% |
| COPD | 2.4% | 2.3% |
Table 3: A table showing GP held respiratory disease registers and the projected count change, and the percentage change this represents. All register counts are projected to increase between the last observed data, 2023/24, and 2033/34. Percentages have been rounded to the nearest whole number and counts to the nearest hundred. (Quality and Outcomes Framework, 2009/10 to 2018/19, and the Quality Assurance and Improvement Framework, 2019/20 to 2023/24, Welsh Government).
As shown in Table 3 and Figure 1, if current trends continue, the number of patients on these GP held registers will continue to increase over the next 10 years. Asthma is projected to increase to over 256,000 and COPD to over 84,000.
This will, in part, happen anyway as the population is increasing, as well as the proportion of older people in the population. One of the main risk factors for respiratory disease is tobacco smoking. Around 90% of cases of COPD are associated with smoking and smoking can increase the frequency of attacks for those with asthma (National Institute for Health and Care Excellence, risk factor for COPD and complications of asthma). Smoking prevalence has fallen between 2003/04 and 2022/23 from 26% to 13% (Welsh Health Survey, 2003/04 – 2015/16, National Survey for Wales 2016/17 - 2022/23, Welsh Government). This may, in turn, lead to reduced prevalence of COPD. Outside of smoking, occupational exposure, such as certain fumes and chemicals, is associated with 20% of COPD cases (30% in lifelong non-smokers) (National Institute for Health and Care Excellence, risk factor for COPD). Smoking and occupational exposure is known to have an additive effect on COPD incidence, for example as described by (Pallasaho et al. 2013). Our projections are unable to account for additive effects.
As smoking prevalence in Wales has decreased, the workforce has become de-industrialised and more stringent workplace legislation introduced to protect health, this will influence COPD prevalence going forward.
5.3 Demographics
Generally, asthma can affect people at all ages while COPD onset occurs in adulthood, most predominantly in older age. In 2023/24, asthma was most prevalent in females ages 65-69, with a prevalence of 11.2% compared to 8.1% in males (Figure 2).
COPD was most prevalent in the 80-84 age group. It is more prevalent in males, with 10.3% of 80-84 year old males being affected, compared to 8.2% in the female population. (Quality Assurance and Improvement Framework, Welsh Government). This is in part due to unhealthy lifestyle behaviours and Wales’ industrial history. As we have become more de-industrialised, and the remaining industrial occupations have better health protection through legislation, these profiles will likely change over the coming years.
Population pyramid for GP held respiratory disease registers 2023/24

Figure 2: COPD prevalence is higher in older people, and for males. Asthma is prevalent across all ages and higher in females (Quality Assurance and Improvement Framework, 2023/24, Welsh Government).
6. Admissions
The measures implemented to try to minimise the spread of COVID-19 had a complex effect on hospital admissions, and the trends in admissions were not comparable with pre-COVID admissions. This section will focus on trends up to 2019/20, with a separate discussion for the recent, post-pandemic data.
Age-standardised emergency admission rates for respiratory disease were increasing prior to COVID-19, from 1,470 per 100,000 in 2011/12 to 1,840 per 100,000 in 2019/20, an increase of 25%. (Patient Episode Database Wales, Digital Health and Care Wales).
Admissions rates fell during the pandemic. Age-standardised admission rates have increased since 2020/21 to 1,504 per 100,000 in 2022/23, however they are still lower than pre-pandemic levels.
The rate of emergency admissions for respiratory disease from people living in the most deprived fifth of Wales is much higher than the rate for those living in the least deprived fifth between 2011/12 and 2022/23 (Figure 3). In 2019/20 the emergency admission rate in the most deprived fifths was around 77% higher than the least deprived fifth, 2,514 adults per 100,000 compared to 1,422 per 100,000 (Patient Episode Database Wales, Digital Health and Care Wales).
Prior to COVID-19, the difference between the emergency admission rates in the most and least deprived fifths decreased from 1,188 per 100,000 in 2016/17 to 1,092 per 100,000 in 2019/20. Although rates in general are lower than pre-pandemic, they are increasing, and the deprivation gap has widened. In 2020/21 the difference was 543 per 100,000 and has grown to 755 per 100,000 in 2022/23. With only three post pandemic data points to date, it is too soon to draw firm conclusions around trend.
Emergency admissions for respiratory disease (J00-J99) by deprivation fifth, European age-standardised rate (EASR) per 100,000

Figure 3: the European age-standardised rate of emergency admissions for respiratory disease has generally increased over time. There was a large drop due to COVID-19, with levels yet to return to pre-pandemic levels. (Patient Episode Database Wales, Digital Health and Care Wales).
Since 2010, pneumonia has been the leading cause of emergency hospital admissions for respiratory disease. In 2019, the last year of data before the pandemic, of 58,897 emergency hospital admission with respiratory disease as a primary diagnosis, 14,320 were attributed to pneumonia (Figure 4). This represents 24% of these admissions (Patient Episode Database Wales, Digital Health and Care Wales). The year on year increase is likely to be due to many factors which include increasing numbers of comorbidities in an ageing population, severe flu seasons and changes to diagnosis coding. It’s important to note that this increasing trend is not reflected in higher numbers of deaths.
While these data focuses on the primary admission cause, it is important to consider underlying conditions. For example, patients with COPD have acute exacerbations that may lead to hospital admission. These are often cause by infection (in other words pneumonia) and may, therefore, be coded as such. Following the pandemic, admission rates began increasing again, with all disease types seeing a sharp initial increase, before a more gradual increase.
Emergency admissions for respiratory disease by type, count

Figure 4: emergency admissions for pneumonia has seen a large increase since 2010. The year on year increase is likely to be due to many factors which include increasing numbers of comorbidities in an ageing population, severe flu seasons and changes to diagnosis coding. It’s important to note that this increasing trend is not reflected in higher numbers of deaths.(Patient Episode Database Wales, Digital Health and Care Wales).
7. Mortality
Over the last 10 years, chronic lower respiratory diseases (ICD-10 codes J40-J47) and influenza and pneumonia (ICD-10 codes J09-J18) were consistently two of the leading underlying causes of death in Wales. The numbers dying from chronic lower respiratory tract disease has been increasing each year since 2020, and in 2023 was the underlying cause for 2,132 deaths. Deaths due to influenza and pneumonia have fluctuated and were the underlying cause for 1,534 deaths in 2023. Combined, these two respiratory disease groups accounted for 3,666 deaths, 10% of all deaths in Wales (Deaths registered in England and Wales, 2014 - 2023, ONS). This combined total was only slightly lower than the leading cause of death, ‘dementia and Alzheimer’s disease’, which was the underlying cause for 3,796 deaths. These figures are based on the underlying cause of death, meaning the disease or injury that initiated the train of events leading directly to death.
There has always been a gap between the most and least deprived WIMD fifths, with those residing in the most deprived fifth being more than twice as likely to die from a respiratory disease compared with those residing in the least deprived fifth. Prior to the pandemic this gap was increasing, with a peak difference of 140 per 100,000 in 2018. In that year, the age-standardised mortality rate in the most deprived fifth was 261 per 100,000 compared to 121 per 100,000 in the least. In 2023, the age-standardised mortality rate in the most deprived fifth was 203 per 100,000 compared to 91 per 100,000 in the least (Figure 5) (Public Health Mortality, Mid-Year Population Estimates, Office for National Statistics).
Deaths from respiratory disease (J00-J99) by deprivation fifth, European age-standardised rate per 100,000
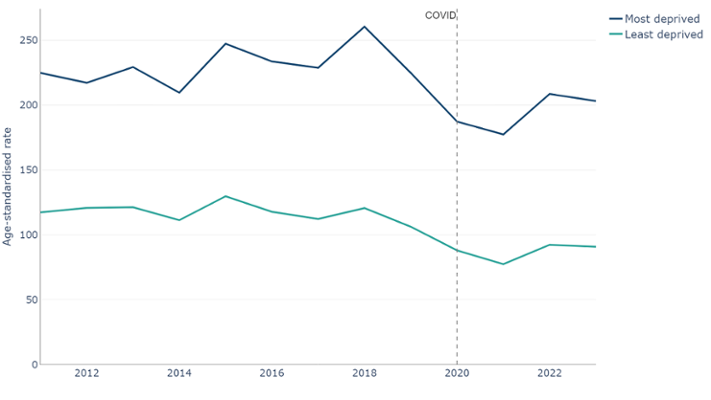
Figure 5: deaths with an underlying cause of respiratory disease, European age-standardised rates (EASR) per 100,000. Dark blue line: Least deprived fifth. Light blue line: Most deprived fifth. There was a clear and consistent gap in deaths between the most and least deprived fifths, with a higher rate in the most deprived fifth. (Public Health Mortality, Mid-Year Population Estimates, Office for National Statistics).
Age-standardised rates of avoidable mortality (Figure 6) for diseases of the respiratory system increased until between 2012-14 and 2016-18, where it plateaued around 39 per 100,000 until the pandemic (Public Health Mortality and Mid-Year Estimates, Office for National Statistics).
From 2018-20 to 2020-22 the rate decreased. However, these years will have been impacted by COVID-19. The latest available period, 2021-23, has seen an increase to 32 per 100,000. This is 6 per 100,000 lower than the 39 per 100,000 reported for the last pre-pandemic period, 2017-2019. There are not yet enough post pandemic data points to draw firm conclusions around trend.
Prior to COVID-19, the age-standardised rate had been decreasing, and due to the ageing population of Wales, these may continue to fall, but absolute numbers and crude rates may continue to increase.
Avoidable mortality for diseases of the respiratory system, 3 year rolling European age-standardised rate per 100,000
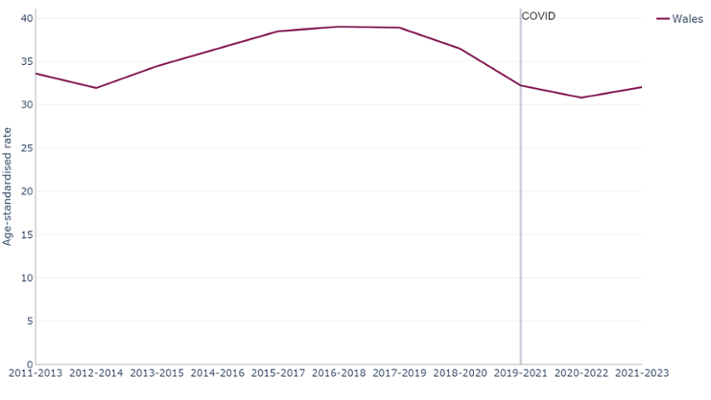
Figure 6: Avoidable mortality of the respiratory system showing that deaths were increasing but have dropped in recent years, potentially due to COVID-19. As this rate is age-standardised, the effects due to the aging population, or population increases have been removed (Public Health Mortality, Mid-Year Population Estimates, Office for National Statistics).
Avoidable mortality for diseases of the respiratory system is defined as all deaths under the age of 75, with influenza, pneumonia, chronic lower respiratory disease and lung diseases due to external agents considered preventable. All other respiratory system diseases are considered treatable. (Avoidable mortality by Integrated Care Boards in England and Health Boards in Wales, Office for National Statistics).
8. Costs and trends
8.1 Overall cost
Since 2009/10, total spending on respiratory problems by NHS Wales has increased from £338 million to £518 million in 2022/23, an increase of 53 %, however this does not take into account inflation.(NHS Expenditure programme budgets, Welsh Government). With inflation, £338 million in 2010 would be the equivalent of £521 million in April 2025.
Of that £518 million:
- £125 million was spent in primary care settings, i.e. the community such as General Practice
- £393 million was spent in secondary care settings, i.e. hospitals. This equates to around 76% of the total
8.2 Prescribing cost
The number of items dispensed through primary care has increased by nearly 60%, between 2001/02 and 2023/24. In 2023/24 around 6.1 million prescriptions were dispensed. (Prescription items and cost by area and BNF chapter, Prescribing Services, NHS Wales Shared Services Partnership). The net ingredient cost of dispensed prescriptions (Figure 7) decreased prior to COVID-19, however, since 2019/20, costs have increased to £88 million in 2023/24. Ingredient costs are because of many factors not just an increase in prescriptions. Other factors could include shortages and newer agents becoming available on the markets that are managing the condition better but more costly.
Number of dispensed respiratory system prescriptions and net ingredient cost between 2001/02 and 2023/24

Figure 7: the number of items prescribed to treat and manage respiratory disease has been gradually increasing to 6.1 million in 2023/24. (Prescribing Services, NHS Wales Shared Services Partnership).
8.3 Inhalers decarbonisation strategy
On average over 4 million inhaler items are prescribed each year, at a cost of around £74 million. In 2023, around 350,000 inhaler items were dispensed in Wales each month. This equates to an approximate spend of £6 million on inhaler items (All Wales Therapeutics and Toxicology Centre, 2023). Many inhalers prescribed are metered dose inhalers (MDIs) classed as high global warming potential medicines due to the use of aerosols which contain environmentally harmful greenhouse gases. MDIs are responsible for 4% of the NHS Wales carbon footprint (over 58.2 million CO2Kg (58,200 CO2Tonnes) annually.
Welsh Government have set targets for all public sector bodies to achieve a net reduction in total carbon emissions of 16% by 2025, and 34% by 2030. Specifically for inhalers, the Welsh Government target is a shift to 80% of inhalers being low global warming potential (GWP) alternatives by 2025. This target was based on findings of the NHS Wales Carbon Footprint 2018-2019 report and included in the NHS Wales Decarbonisation Strategic Delivery Plan, 2021.
In response to the Delivery Plan a Task and Finish Group - Decarbonisation – Inhaler Use and Disposal was established in December 2022. Subsequently the, Decarbonisation: Inhaler Prescribing, Use and Disposal Strategy 2023 was endorsed and published by All Wales Medicines Strategy Group,
One aspect of this strategy focuses on the prescribing and use and disposal of inhalers. The aim is to:
- ensure inhalers are being prescribed appropriately, particularly around repeat prescriptions
- signpost prescribers to inhalers with lower carbon footprints when clinically appropriate
- ensure patients are using inhalers correctly
- emphasise the importance of inhaler-specific disposal and recycling
Ensuring inhalers are prescribed, and used, appropriately has clear benefits for patients. A reduction in prescriptions could lead to a reduction in cost and reduce the carbon footprint of NHS Wales.
All Wales Prescribing Guidelines for COPD and asthma in adults and asthma in children promote safe effective and appropriate treatment for asthma and COPD and reinforce prescribing of lower GWP inhalers.
Prescribing of inhalers and their carbon footprint is monitored using SPIRA. Despite the downwards trend reported for the prescribing of high global warming inhalers, 98% of inhalers prescribed in 2021 as GWP inhaler to 42% in September 2024 (All Wales Therapeutics and Toxicology Centre 2024), it is unlikely the target of 80% of inhalers being low global warming potential (GWP) alternatives by 2025 will be met.
9. Immunisation and vaccines
There are several immunisation programmes in Wales specifically designed to prevent the spread of certain respiratory illnesses. NHS Wales runs seasonal influenza and bi-annual COVID-19 programmes for those at highest clinical risk. Pneumococcal vaccines (both pneumococcal conjugate vaccine (PCV) and pneumococcal polysaccharide vaccine (PPV)), as well as the newly implemented respiratory syncytial virus (RSV) vaccine, are offered all year round to eligible groups. While the symptoms of these illnesses can be mild, some individuals may experience more severe symptoms leading to hospitalisation and potentially death. This is particularly true for vulnerable populations, such as the elderly, immunocompromised, people with asthma and COPD, and new-borns in the case of respiratory syncytial virus. The aim of these vaccination programmes is to prevent disease transmission and reduce disease severity if transmission does occur.
9.1 Respiratory disease immunisation programme summary
Public Health Wales publishes weekly reports on influenza and acute respiratory infections detailing current levels of activity, as well as annual reports. There are also a number of public facing dashboards and reports that include vaccination data.
The influenza and COVID-19 vaccination programmes are run annually and bi-annually respectively. Generally, vaccination uptake for influenza is higher in adults aged 65+ than persons aged 6 months to 64 years in a clinical risk group.
A RSV immunisation programme for older adults and pregnant women commenced on 1st September 2024. This programme aims to protect thousands of infants and older people from serious illness each winter, keeping more people out of hospital and from needing to see a GP. Unlike the flu and COVID-19 immunisation programmes, this vaccination is offered all year round.
There are two different pneumococcal vaccinations. Pneumococcal Conjugate Vaccine (PCV) is given to children as part of the routine immunisation programme and some individuals who are at risk due to underlying medical conditions. In the 2023-24 year, 96.0% of eligible children received the first PCV vaccination and 92.6% received the second dose (Annual COVER report, Public Health Wales).
Pneumococcal Polysaccharide Vaccine (PPV) is routinely offered to all adults aged 65 years of age and over and offered to persons aged between two years and 64 years with underlying medical conditions which make them more prone to developing pneumococcal disease. In 2024, 65% of eligible adults aged 65+ received the PPV vaccination, compared to 37% of eligible adults in the clinical at-risk group aged 2-64 years. (Pneumococcal polysaccharide vaccination (PPV) uptake in Wales in 2023/24, Public Health Wales).
10. Risk factors
Behavioural factors are key risk factors for respiratory health and are covered in more detail in our risk factors article. This includes smoking, physical inactivity and individuals living with obesity. Air pollution is another risk factor for respiratory disease and will be explored in this section.
10.1 Environmental factors
10.1.1 Outdoor air pollution
Outdoor air pollution is influenced not only by emissions from transport and industry, but also natural sources such as dust, pollen and wildfires (Kovats and Brisley, 2021).
Air pollution has broadly been improving since 2007 (Figure 8). The average concentration of nitrogen dioxide (NO2) in Wales has almost halved, from a concentration of 14µg/m3 in 2007 to around 8µg/m3 in 2022. In the same period, PM10 has decreased from 16 µg/m3 to 11 µg/m3, and PM2.5 from 9 µg/m3 to 7 µg/m3 (Air pollution in Wales, Welsh Government). This is thanks to policies and strict targets to reduce pollution from industry, transport and the energy sector. However, air pollution is still a major environmental contributor to premature death. Our understanding of the impact of poor air quality on health has increased, with recent WHO Global Air Quality Guidelines recommending that countries lower their air quality limits to reflect the increasing evidence of health effects at lower levels of air pollution. The most susceptible in society to the negative impacts of air pollution are the young, elderly and those with pre-existing medical conditions.
Air pollution is estimated to cost UK health and social care services in the region of £5bn–£18bn per year. Work in England suggests that a reduction of just 1μg/m3 of PM2.5 could prevent 50,900 cases of coronary heart disease, 16,500 strokes, 4,200 lung cancers and 9,300 cases of asthma in people aged over 18 years by 2035 (Pimpin et al., 2018). This does not only benefit health directly but reduces health service costs and increases economic productivity because workers, and their families, are healthier and need fewer “sick days”.
While at a national level air pollution indicators for the Wales average all fall below the national air pollution standards, some hyper local areas have poorer air quality. Cardiff and Port Talbot have, at times, recorded higher levels of PM10 than Birmingham or Manchester (Senedd Cymru, 2018).
Air pollution in Wales, concentration (µg/m3)
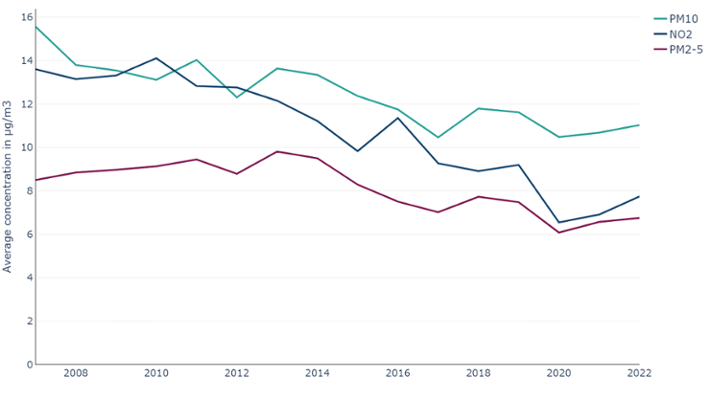
Figure 8: Air pollution in Wales has been improving over time, with an overall decrease in levels of NO2, PM10 and PM2.5, with all three being below the yearly limit values at a national level. Due to the localised nature of air pollution, this adherence may vary at smaller geographies. (Air pollution in Wales, 2007-2022, Welsh Government).
Air pollution can have a significant impact on chronic health. UK regulations require the measurement of several air pollutants, the most commonly monitored are;
- the concentration of particles with a diameter smaller than 10 micrometres (PM10)
- the concentration of particles with a diameter smaller than 2.5 micrometres (PM2.5)
- nitrogen dioxide (NO2)
The size of the particulate matter fractions is important, with smaller particles being able to enter the bloodstream and be transported around the body, lodging in the heart, brain and other organs, increasing the risk of developing heart and circulatory diseases amongst others. Exposure to NO2 can harm the heart and lungs.
Collective actions are needed to improve air quality for all, and these are possible through regulation, policy, technology and individual efforts. Use of cars and other vehicles makes a significant contribution to air pollution, particularly over short distances. Policy and practice efforts to make it easier for more people to choose active travel or public transport are essential, as are options to reduce travel for work.
Evidence from the Public Health Wales Making a difference report shows that active travel and public transport use has much greater societal benefits than car use. Air pollution has a chronic cumulative effect, meaning it can take decades to see the impact of any air pollution improvements. This is why it is vital to improve healthy behaviours, such as physical activity, as they have a much greater, and more immediate, health benefit than the detriment associated with exposure to air pollution (Mitsakou et al., 2021).
10.1.2 Indoor air pollution and environmental hazards
Damp and mould in the home is one example of an indoor environmental hazard. Other factors include radon, smoking and wood burning stoves and heaters. While we cannot disentangle their relative contributions, it is important to measure any factors we can, particularly if they are modifiable. These sources of indoor pollution and environmental hazards are risk factors for the development, or exacerbation, of respiratory diseases. The effect of damp and mould, can range from general symptoms such as coughing and wheezing, increased risk of airway infections and even the development or worsening of respiratory diseases like asthma and COPD.
Local authorities perform Housing, Health and Safety Rating System (HHSRS) assessments each year. In 2023/24, 4,821 assessments were carried out, 1,929 (40%) of which were found to have damp and mould growth (Hazards and licences data collection, Welsh Government). Whilst it covers all residential premises, the HHSRS is more commonly used to assess standards in private sector housing.
10.2 Climate change
Climate change is a risk for everyone and is a direct threat to respiratory health. A study in 2014 stated that climate change can directly promote or aggravate respiratory disease or increase exposure to risk factors for respiratory disease. This can happen through increasing the amount of pollen and allergen produced by each plant, mould proliferation and the concentrations of outdoor ozone and particulate matter at ground level (D’Amato et al., 2014).
A health impact assessment by Public Health Wales also highlighted the impact climate change can have on respiratory disease, through increased heat and poorer air quality (Edmonds and Green, 2023).
10.3 Wider determinants - deprivation
As highlighted in sections 6 and 7, there is a noticeable and persistent gap in the respiratory disease mortality rates and admission rates between people living in the most and least deprived areas in Wales. This is also reflected in the prevalence of behavioural risk factors, including smoking. In 2022/23, 22% of adults in the most deprived fifth reported to be a current smoker, compared to 8% in the least deprived fifth (Figure 9) (National Survey for Wales, 2022/23, Welsh Government).
Percentage of adults reporting to be current smokers by deprivation fifth
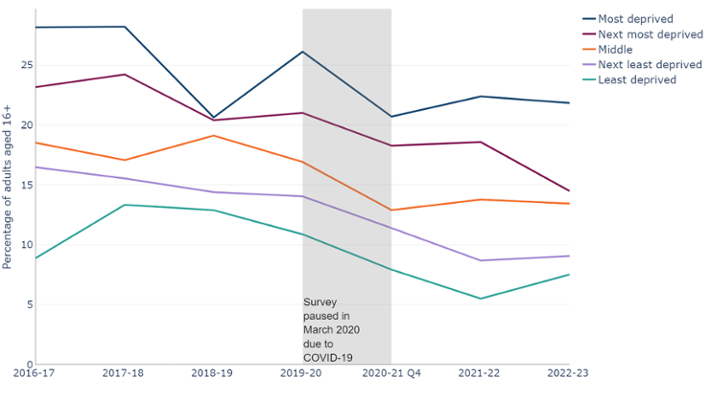
Figure 9: There is a clear pattern for the prevalence of current smokers increasing as deprivation increases. Smoking prevalence is almost 3 times higher in the most deprived fifth than the least deprived fifth. Note 1: Survey paused in March 2020 due to COVID-19. (National Survey for Wales, observed percentage, 2016/17 - 2022/23, Welsh Government).
As covered in our cardiovascular disease article, deprivation may have an effect beyond unhealthy behaviours. Analysis by The Kings Fund looked at the relationship between poverty and the NHS. In 2022, a survey showed that 56% of NHS providers reported an increase in people delaying seeking help due to the cost of living. It also cited access difficulties which include practical issues, such as the ability to travel to medical appointments and health literacy (The Kings Fund, 2025).
11. An overview of services, programmes, prevention services and legislation in Wales
Here, we outline some of the strategies and legislation, programmes and services aimed at reducing the prevalence of some of the risk factors described in this article. This is not an exhaustive list, and if you have a programme or service you would like added to the list, please contact us via Publichealthwalesobservatory@wales.nhs.uk.
11.1 Strategies and Legislation
- Tobacco and Vapes Bill: introduced into the House of Commons on 5 November 2024, it would make it illegal to sell tobacco products to anyone born after 1 January 2009 and includes proposals to create powers for UK and devolved administrations to extend smoke and vape-free spaces, restrict vape packaging, display and flavours and to licence tobacco and vape retail outlets.
- Environment (Air pollution and Soundscapes) (Wales) Act 2024: The Act allows Welsh Ministers to set targets in relation to air pollution, creates new duties for the Welsh Ministers to take steps to promote awareness of the risks to human health caused by air pollution, and ways of reducing or limiting air pollution and places a duty on Welsh Ministers to promote active travel as a way of reducing or limiting air pollution and makes provision for this duty to be imposed by regulations, on other public authorities.
- As part of the NHS Wales decarbonisation strategic delivery plan, a strategy for the decarbonisation of inhalers in Wales was launched in 2023. Ensuring inhalers are prescribed, and used, appropriately has clear benefits for patients. A reduction in prescriptions could lead to a reduction in cost and reduce the carbon footprint of NHS Wales. Climate change is a risk for everyone and is a direct threat to respiratory health.
- Under the Housing act 2004, the National Assembly for Wales issued statutory guidance to local housing authorities in Wales on the use of the Housing Health and Safety Rating System. This is a system developed to assess the main potential housing related hazards, including ones that may impact respiratory disease such as damp and mould.
11.2 Services
- Healthy Weight Healthy You is a comprehensive strategy by Welsh Government aimed at preventing and reducing obesity. As part of this the Healthy Weight Healthy You programme offers personalised guidance to support individuals to manage their weight effectively. Health Boards across Wales also offer services to support individuals to manage their weight.
- Help Me Quit was launched in 2017 and is a single brand for NHS stop smoking services in Wales. Help Me Quit is delivered by Public Health Wales and local health boards.
- Immunisation and vaccination programmes are established in Wales to prevent the spread of respiratory illnesses. This includes programmes for:
12. Data quality and interpretation
12.1 COVID-19 pandemic
When considering these trends, it is important to consider the potential impact of the COVID-19 pandemic and primary care management in general. During the pandemic, access to services was reduced in 2020. This is likely to have led to a fall in diagnosis and treatments, followed by a surge once services became available again.
12.2 Prevalence data
The prevalence data are from the Quality and Outcomes Framework (2009/10 to 2018/19) and the Quality Assurance and Improvement Framework (2019/20 onwards) from Welsh Government. This data, supplied by GPs, shows the number of registered patients on a particular disease register and the total registered population.
When interpreting GP register data, it is important to note changes to policy and healthcare developments may have an impact, such as incentives for identifying certain diseases or improved disease detection respectively, and not reflect an actual change in prevalence rate. This means it can be difficult to ascertain if a change represents a true change or is due to a change in data collection. When the Quality Assurance and Improvement Framework replaced the Quality and Outcomes Framework in 2019/20, the change in contract for data collection from primary care potentially led to changes in data quality. Specifically, under counting data due to poorer-quality coding (Davies et al., 2025).
The data comes from a single data source based on GP registered patients. As a result, it does not capture anyone who may be undiagnosed or diagnosed but not registered. This means that the figures provided are potentially an undercount of the true prevalence.
12.3 Projection methods
For our projections, we have used an ARIMA model. The model projects historic prevalence counts forward to 2033/34. The figure we refer to in the article, the central estimate, is the most likely estimate, given what has already been observed. We have also provided 95% upper and lower confidence intervals, estimating an interval in which a future prevalence might fall. These indicate that we are 95% confident that the predicted projection will fall within these bounds.
These projections are indicative and are intended to show the likely direction of travel should nothing change over the period. For example, the introduction of a health or policy intervention, such as a smoking ban, might change a trajectory.
All data are available in the data download. If you would like more information on the technical details of the projections, please contact us:Publichealthwalesobservatory@wales.nhs.uk.
12.4 Patient Episode Database Wales
Our admissions data uses the Patient Episode Database Wales (PEDW). PEDW is a national database that captures information on hospital activity. These data are provided by health boards. Variations in data completeness, such as missing diagnosis fields and admission methods, can impact the accuracy of analyses. As such, analyses should be interpreted with caution as they may result in underestimates of the true figures. However, these limitations hold for observational data in general and these data are the best we have available to us for such analyses. More information on PEDW completeness can be found on the DHCW website.
12.5 Self-reported survey data
Data relating to lifestyle behaviours are collected through the following surveys:
- Welsh Health Survey
- National Survey for Wales
As with all surveys reliant on self-reported data, which can be affected by various sources of bias. These can include social desirability, recall, or response styles. For example, people may under-report how often they consume alcohol and over report how often they exercise.
Sample sizes affect the degree of confidence with which we can report findings. Where possible, we have included 95% confidence intervals in the data downloads. This represents a range of values that we can be 95% confident contains the ‘true’ underlying rate. In general, the larger the sample size, the smaller the gap between the upper and lower confidence intervals.
This article reports observed percentages without adjusting for changes in age structure. Age standardised percentages would provide fairer comparisons over time, especially for age-influenced behaviours and will be added to data downloads at a later date. Currently, observed percentages are presented to highlight their direct impact on services and planning since they represent the actual percentage in the population.
12.6 Welsh Health Survey
The Welsh Health Survey ran from 2003/04 to 2015 and had a target sample of 15,000. In 2016, the Welsh Health Survey was replaced with the National Survey for Wales. Archived data and technical reports are available online.
12.7 National Survey for Wales
The National Survey for Wales replaced the Welsh Health Survey in 2016. Although it is the successor to the Welsh Health Survey, they should not be compared. This is because as the survey methodology changes, we may see a step change that is simply related to the methods change. For some healthy behaviours, there may also be a change in the CMO guidelines, meaning that long-term analyses are unavailable. However, whilst one needs to consider this step change as the methodology changes, conclusions about long-term trends may still be deduced. Only two analyses cover both surveys, BMI and smoking trends. The categorisation for both remains the same throughout the periods. However, there may once again be a small step-change between surveys that may be due to the change in survey as opposed to a natural change.
Due to the covid-19 pandemic, the National Survey for Wales had to change its usual delivery method, that consisted of a combination of face-to-face and telephone interviews. The monthly and quarterly surveys between May 2020 and March 2021 were large-scale, random sample telephone surveys, reaching around 1,000 people per month. A total of 12,000 people were included during that year. From July 2021, a sub-sample of respondents were asked to complete an online section following the telephone section. Because of this method change, results cannot be directly compared. However, as with the change from Welsh Health Survey to National Survey for Wales, any step-change must be considered. This does not mean that there has not been an actual behavioural change following the COVID-19 pandemic. This is why considering the long-term data series is crucial. Further information on the survey methodology and technical information are available from Welsh Government.
12.8 Air pollution
The UK monitors air pollution nationally through several networks of monitoring stations. The largest network, the Automatic Urban and Rural Network (AURN), monitors concentrations of the most well-known pollutants is called the, which reports data hourly in near real-time on the UK-AIR website. In addition there are Local Authority, academic and industry operated monitoring networks.
National statistics on air pollution in the UK are produced in April each year and provide an accessible assessment of long-term trends in air pollution as measured by the AURN. In September each year, measurements from the national monitoring networks are combined with modelling outputs to form a national assessment of air pollution against the limit and target values for concentrations of air pollutants set internationally and domestically. The government publishes an annual report on the results of this assessment, and the modelling data used for this report are published in an interactive map on the UK-AIR website.
Each year the UK Government’s Pollution Climate Mapping (PCM) model calculates average pollutant concentrations for each square kilometre of the UK. The model is calibrated against measurements taken from the AURN.
The Welsh Government has used these published data to assign a concentration of NO2, PM2.5 and PM10 to each residential dwelling in Wales based on which square kilometre of Wales it sits in.
For each local authority and local health board, a population-weighted average over its constituent census output areas were calculated to give an average NO2, PM2.5 and PM10 concentration based on where people live in those local authorities and health boards. The same calculation was also repeated over all census output areas, to give a comparable figure for the whole of Wales.
For the 2022 update of the air pollution national indicators, a methodological improvement was implemented to the way in which the dwelling weights are calculated.
More information on the data used can be found on the Department for Environment Food & Rural Affairs website.
12.9 Housing, Health and Safety Rating System (HHSRS)
The information presented here covers the condition of residential properties, including Houses in Multiple Occupation (HMOs), assessed by local authorities under the Housing Health and Safety Rating System (HHSRS).
The HHSRS is used to determine whether residential premises are safe to live in. It replaced the Fitness Standard in July 2006. Local authorities use the System to determine whether a hazard exists that may cause harm to the health and safety of a potential occupant.
12.10 Prescriptions
The prescription data contains the total number of units prescribed (irrespective of where they were dispensed) or dispensed by General Medical Practitioners in Wales. One item Net ingredient cost refers to the cost of the drug before discounts and does not include any dispensing costs or fees. Net ingredient costs for all years are not adjusted for inflation. Standard adjustments for inflation are not considered appropriate as drug prices are subject to controls under the Pharmaceutical Price Regulation Scheme and to other central controls. More information on this data is available from Welsh Government.
13. Download the data
We are aware that there can be issues downloading the data files in Microsoft Edge. If you would like the data, you may need to use a different browser, use 'Save as' if the data opens in an online tab or contact us at Publichealthwalesobservatory@wales.nhs.uk
13.1 Download the data in this article – Excel
13.2 Download the data from this article with additional breakdowns - CSV
13.3 Download risk factor data with additional breakdowns - CSV