Public Health Outcomes Framework (PHOF 2026)
We have identified a problem with our analysis of the National Survey for Wales data within this reporting tool. We have temporarily removed all National Survey for Wales indicators while we correct the figures.
Published: 18 March 2026
Latest news
-
In this iteration, the following indicators have been updated: Life expectancy; people in education, employment or training; smoking in pregnancy; premature deaths from key non-communicable diseases; deaths from injuries; deaths from road traffic injuries; suicides; quality of the air we breathe; hip fractures among older people; avoidable mortality; and avoidable mortality by cause.
-
The rate of avoidable mortality from endocrine and metabolic diseases (a category that includes diabetes and obesity) is rising steeply, from 3.5 in 2011-13 to 5.8 in 2022-24. This represents an increase of 66% over the period. For more information on diabetes prevalence and what is being done to tackle it, please see the Diabetes prevalence – trends, risk factors, and 10-year projection report.
-
The rate of avoidable mortality from alcohol/drug-related causes has also steadily risen, in females from 15.3 per 100,000 in 2011-13 to 21.2 per 100,000 in 2022-24, and in males from 31.6 to 43.9. This represents a 45% increase for males and a 39% increase for females. The recent Public Health Wales annual profile for substance misuse 2023-2024 presents stark inequalities in drug and alcohol-related deaths. The report authors highlight the importance of access to substance misuse services, whilst also calling for investment in prevention.
-
In females, cancer is the most common cause of avoidable mortality, leading to around 1,200 deaths per year. Further information about cancer and inequalities is available in the Inequalities in cancer incidence in Wales by socio-demographic characteristics, 2011-2020 - Public Health Wales report.
-
In males, circulatory disease is the most common cause of avoidable mortality with rates remaining consistent since 2011-13. This leads to around 1,550 deaths per year. Avoidable mortality rates for males from both circulatory and alcohol/drug-related mortality are more than double the equivalent rates for females in the latest period.
-
The average NO2 concentration in residential areas has continued its broadly downward trend, reaching 6.8µg/m³ in 2023.
-
The percentage of mothers who reported as smoking at birth in the 2024 period ranges from 7.6% in Powys THB to 15.8% in Betsi Cadwaladr.
-
In 2024, 88% of 16-18 year-olds and 85% of 19-24 year-olds were in education, employment or training.
-
Life expectancy is slightly higher in 2022-24 than in 2021-23 for both females and males. In females, life expectancy has returned to the pre-Covid figure of 82.2 years from 2017-19. The same is true for men, returning to 78.3 years. It should be noted however that life expectancy has been stagnating in Wales since 2011-13, which is a significant change following the consistent increases in life expectancy across previous decades. This stagnation is broadly reflected across G7 countries, for example in Germany and the USA.
-
Across local authorities in Wales, life expectancy in males ranges from 75.0 years in Merthyr Tydfil to 80.3 years in Vale of Glamorgan, Powys and Monmouthshire. In females, life expectancy ranges from 79.2 years in Blaenau Gwent to 84.6 years in Monmouthshire.
-
Age-standardised rates of premature deaths from non-communicable diseases in Wales have fallen from 324.2 per 100,000 in 2011-13 to 307.6 per 100,000 in 2022-24, a statistically significant decrease.
-
The rate of premature deaths from non-communicable diseases in the most deprived fifth is more than twice that in the least deprived fifth in 2022-2024 (486 vs 192 per 100,000). The gap between most and least deprived fifth has been widening since the 2012-2014 period, mostly due to rates in the least deprived fifth falling.
-
The rate of deaths from injuries was significantly higher in 2022-24 compared to 2021-23. The largest rise occurred in those aged 65 and over. The increase is largely in males but is observed in females as well. The increase is seen in all deprivation quintiles. As previously noted, deaths from falls have been increasing in recent years. Part of the rise in deaths coded as falls may reflect changes in coding practice, where falls in older people may previously have been recorded using a more generic code for old age.
-
The age-standardised rate of deaths from road traffic injuries is nearly four times higher in males than females (4.9 vs 1.3 per 100,000). No trend is available for these data due to relatively small numbers of deaths from road traffic injuries (around 100 per year in Wales).
-
There has been a slight increase in the age-standardised rate of registrations of death by suicide in 2020-24 (13.1 per 100,000) compared to 2019-23 (12.5 per 100,000). The rate for males is over three times higher than for females (20.9 compared to 5.9 per 100,000). For males, the rate in the most deprived fifth is around twice that of the least deprived fifth (28.6 compared to 13.7 per 100,000), and the gap between the two groups has widened since 2011-15. Please be aware that the data are likely to be incomplete, particularly for the most recent periods. For deaths by suicide by date of death (also known as ‘suicide occurrences’), please see the data series on Suicide occurrences, England and Wales - Office for National Statistics. In addition, more timely information on death by suspected suicide can be found in the Real Time Suspected Suicide Surveillance (RTSSS) Annual Report: Deaths by suspected suicide 2024-25 - Public Health Wales.
Indicator Map
Feedback
What’s next?
We’re developing the tool in an iterative way, and so we’ll be updating it regularly. A publication timetable for the updates can be found below.
NI = National Indicator
| Data source | Indicator | Published | Publication Quarter |
|---|---|---|---|
| PHM | Life expectancy at birth | ✔ | Q2 |
| Healthy life expectancy at birth | ✔ | Q2 | |
| The gap in life expectancy at birth between the most and least deprived | ✔ | Q2 | |
| The gap in healthy life expectancy at birth between the most and least deprived NI | ✔ | Q2 | |
| Premature death from key non communicable diseases | ✔ | Q1 | |
| Deaths from injuries | ✔ | Q1 | |
| Deaths from road traffic injuries | ✔ | Q1 | |
| Suicides | ✔ | Q1 | |
| PEDW | Hip fractures among older people | ✔ | Q1 |
| NSW | Mental well-being among adults NI | ✔ | Q4 |
| The gap in mental well-being between the most and least deprived among adults | Data not available | N/A | |
| People able to afford everyday goods and activities NI | ✔ | Q4 | |
| A sense of community NI | ✔ | Q4 | |
| People who volunteer NI | ✔ | Q4 | |
| People feeling lonely NI | ✔ | Q4 | |
| Adults eating five fruit or vegetable portions a day | ✔ | Q4 | |
| Adults meeting physical activity guidelines | ✔ | Q4 | |
| Adults who smoke | ✔ | Q4 | |
| Adults drinking above guidelines | ✔ | Q4 | |
| Working age adults in good health | ✔ | Q4 | |
| Working age adults free from limiting long term illness | ✔ | Q4 | |
| Life satisfaction among working age adults | ✔ | Q4 | |
| Working age adults of healthy weight | ✔ | Q4 | |
| Older people in good health | ✔ | Q4 | |
| Older people free from limiting long term illness | ✔ | Q4 | |
| Life satisfaction among older people | ✔ | Q4 | |
| Older people of healthy weight | ✔ | Q4 | |
| SHRN/HBSC | Adolescents of healthy weight | ✔ | Q4 |
| Physical activity in adolescents | ✔ | Q4 | |
| Adolescents who smoke | ✔ | Q4 | |
| Adolescents using alcohol | ✔ | Q4 | |
| Adolescents drinking sugary drinks once a day or more | ✔ | Q4 | |
| ONS | Teenage pregnancies | ✔ | Q4 |
| LFS/APS | People in education, employment or training NI | ✔ | Q4 |
| Gap in employment rate for those with long term health condition | ✔ | Q3 | |
| VPDP | Vaccination rates at age 4 | ✔ | Q3 |
| HBMD | Smoking in pregnancy | ✔ | Q4 |
| NCCHD | Low birth weight NI | ✔ | Q3 |
| Breastfeeding at 10 days | ✔ | Q3 | |
| Data not identified | Mental well-being among children and young people NI | Data not available | N/A |
| Gap in mental well-being among children and young people | Data not available | N/A | |
| SW | Children living in poverty | ✔ | Q2 |
| FPF | Young children developing the right skills NI | Data not available | N/A |
| WED | School leavers with skills and qualifications NI | Data not available | N/A |
| Data not identified | School leavers with essential literacy and numeracy skills | Data not available | N/A |
| HLCC | Quality of housing NI | ✔ | Q1 |
| DEFRA | Quality of the air we breathe NI | ✔ | Q1 |
| CMP | Children age 5 of healthy weight | Data not published yet | N/A |
| WDS | Tooth decay among 5 year olds | ✔ | N/A |
| Domains |
|---|
| Overarching outcomes |
| Living conditions that support and contribute to health now and in the future |
| Ways of living that improve health |
| Health throughout the life course |
All the data presented in this reporting tool are for Wales residents, and the geographies within the 7 Welsh Local Health Boards and 22 Local Authority areas.
|
NHS Wales health boards: |
Local authorities (LA’s) in Wales:
|
|
Aneurin Bevan University Health Board (UHB)
|
Blaenau Gwent Caerphilly Monmouthshire Newport Torfaen |
|
Betsi Cadwaladr UHB
|
Conwy Denbighshire Flintshire Gwynedd Isle of Anglesey Wrexham |
|
Cardiff and Vale UHB
|
Cardiff Vale of Glamorgan |
|
Cwm Taf Morgannwg UHB
|
Bridgend Merthyr Tydfil Rhondda Cynon Taf |
|
Hywel Dda UHB
|
Carmarthenshire Ceredigion Pembrokeshire |
|
Powys Teaching Health Board (THB)
|
Powys |
|
Swansea Bay UHB
|
Neath Port Talbot Swansea |
Some indicators are split into 2011 urban and rural classification. Settlements that fall outside of more than 10,000 resident population are categorised as rural.
Further developments to the tool in the latter end of 2023 aims to split indicators further into sub-local authority geographies include upper, middle and lower super output areas.
National Survey for Wales:
The NSfW involves around 12,000 people each year and covers a broad range of topics. The main purpose is to provide information on the views and behaviours of adults in Wales.
Data presented in the tool is by financial year, although presented in the trend tab, direct comparisons over time are not possible due to the significant change in methodology each year. Additionally, not all questions were asked during each survey period.
Useful links
Patient Episode Database for Wales:
The Patient Episode Database for Wales (PEDW) comprises records of all episodes of inpatient and day case activity in NHS Wales hospitals. Hospital activity for Welsh residents treated in other UK nations (primarily England) is also included. The data is collected and coded at each hospital. The records are then electronically transferred to Digital Health Care in Wales, who validate and merge into the main database.
From 2019/20 onward, there was a reduction in total emergency admissions due to the Covid-19 pandemic. This should be given due consideration when analysing trends in hip fracture admissions among older people.
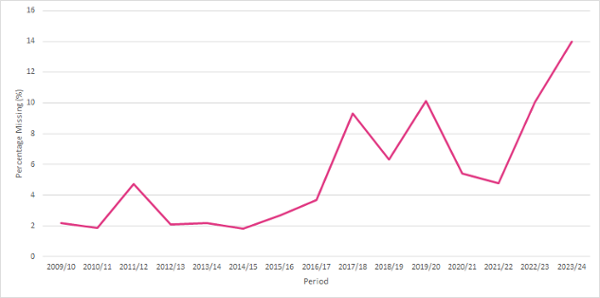
Please note that there is an issue with diagnostic coding in several health boards. Table 1 illustrates how the missing codes are distributed by financial year and health board, as at August 2022. Counts of specific diagnoses will be underestimated, but to an unknown extent, therefore caution should be exercised when interpreting trends for these health boards. Additionally, where the percentage of missing diagnoses is over 10%, the value has been suppressed.
Table 1 Missing diagnostic codes within trauma and orthopaedics, emergency admissions (excluding transfers), persons aged 65+, by area and financial year
|
Area |
Financial year |
Missing Records |
|
Aneurin Bevan UHB |
2017/18 2018/19 2019/20 2021/22 2022/23 2023/24 |
20% 15% 17% 12% 16% 22% |
|
Betsi Cadwaladr UHB |
2023/24 |
15% |
|
Cardiff and Vale UHB |
2011/12 2022/23 2023/24 |
25% 21% 18% |
|
Cwm Taf Morgannwg UHB |
2019/20 2022/23 |
16% 11% |
|
Hywel Dda UHB |
2017/18 2019/20 2020/21 |
21% 21% 16% |
|
Swansea Bay UHB |
2022/23 2023/24 |
14% 16% |
|
Blaenau Gwent |
2017/18 2018/19 2019/20 2021/22 2022/23 2023/24 |
11% 17% 15% 11% 13% 26% |
|
Caerphilly |
2017/18 2018/19 2019/20 2022/23 2023/24 |
17% 10% 16% 12% 16% |
|
Cardiff
|
2011/12 2022/23 2023/24 |
26% 23% 20% |
|
Carmarthenshire |
2017/18 2018/19 2019/20 2020/21 2023/24 |
38% 19% 37% 20% 17% |
|
Ceredigion |
2017/18 2019/20 2020/21 |
13% 19% 27% |
|
Conwy |
2023/24 |
20% |
|
Denbighshire |
2023/24 |
14% |
|
Flintshire |
2023/24 |
10% |
|
Gwynedd |
2023/24 |
18% |
|
Isle of Anglesey |
2009/10 2023/24 |
11% 19% |
|
Merthyr Tydfil |
2011/12 2019/20 2022/23 |
11% 21% 11% |
|
Monmouthshire |
2016/17 2017/18 2018/19 2019/20 2021/22 2022/23 2023/24 |
10% 17% 15% 18% 16% 18% 28% |
|
Neath Port Talbot |
2022/23 2023/24 |
15% 16% |
|
Newport |
2016/17 2017/18 2018/19 2019/20 2021/22 2022/23 2023/24 |
13% 33% 18% 19% 11% 18% 20% |
|
Rhondda Cynon Taf |
2019/20 2020/21 2022/23 |
24% 10% 14% |
|
Swansea |
2022/23 2023/24 |
13% 16% |
|
Torfaen |
2016/17 2017/18 2018/19 2019/20 2021/22 2022/23 2023/24 |
11% 17% 19% 18% 13% 19% 26% |
|
Vale of Glamorgan |
2011/12 2022/23 2023/24 |
22% 17% 15% |
|
Wales |
2019/20 2022/23 2023/24 |
10% 10% 14% |
Figure 1 Missing diagnostic codes within trauma and orthopaedics, emergency admissions (excluding transfers), percentage, Wales, 2009/10 to 2023/24
Useful links
PEDW Statistical publications, data products and open data
Life expectancy (LE)/ Healthy life expectancy (HLE) at birth:
Life expectancy (LE) at birth is an estimate of the average number of years that newborn babies could expect to live, assuming that current mortality rates for the area in which they were born applied throughout their lives. It is calculated using the abridged life table method which is the preferred method of the Office for National Statistics (ONS). As all LE calculations are based on current mortality rates, average life expectancy will change over the course of a lifetime irrespective of other factors. These should therefore be considered as comparative population measures of mortality during a period of time rather than as predictions of actual individual life expectancy.
Healthy life expectancy (HLE) at birth is an estimate of the average number of years that newborn babies could expect to live in good health, assuming that current mortality rates and levels of good health for the area in which they were born applied throughout their lives. Healthy Life Expectancy is calculated using the Sullivan method which is the preferred method of the ONS for calculating healthy life expectancy at birth. Its calculation involves combining health status data from the Annual Population Survey (APS) and Census with the mortality and population data used for LE. ‘Healthy’ is judged to be a response of very good or good to the APS question “How is your health in general; would you say it was … Very Good, Good, Fair, Bad, Very Bad”.
Within the current version of the Public Health Outcomes Framework reporting tool, the following work is presented:
- Life expectancy in Wales, health boards and local authorities: Life expectancy for local areas of Great Britain: between 2001 to 2003 and 2021 to 2023 (ONS 2024)
- Life expectancy in Wales by Welsh Index of Multiple Deprivation (WIMD) fifth: Healthy life expectancy by national area deprivation, England and Wales: between 2013 to 2015 and 2020 to 2022 (ONS 2025)
- Life expectancy by rurality, and by WIMD fifth in health boards and local authorities: produced internally by the data science and analysis division
- Healthy life expectancy in Wales, health boards and local authorities: Healthy life expectancy in England and Wales: between 2011 to 2013 and 2021 to 2023 (ONS 2024)
- Healthy life expectancy in Wales by Welsh Index of Multiple Deprivation (WIMD) fifth: Healthy life expectancy by national area deprivation, England and Wales: between 2013 to 2015 and 2020 to 2022 (ONS 2025)
- Healthy life expectancy by rurality, and by WIMD fifth in health boards and local authorities: Health expectancies in Wales with inequality gap profile (PHW 2022)
More information is available:
ONS website: Life Expectancy releases and their different uses.
ONS website: Health state life expectancies, UK quality and methodology information: 2021 to 2023
Annual Population Survey (APS), ONS
The APS is a continuous household survey covering the UK, with topics including employment and unemployment, as well as housing, ethnicity, religion, health and education. Its purpose is to provide information on the UK labour market. The APS is used to estimate the following proportions:
-
Labour market status of those in full-time education;
-
Labour market status of those in part-time education;
-
Full-time and part-time employment of those in Work Based Learning, who are employed;
-
Employer sponsored 'off-the-job' training for those in employment.
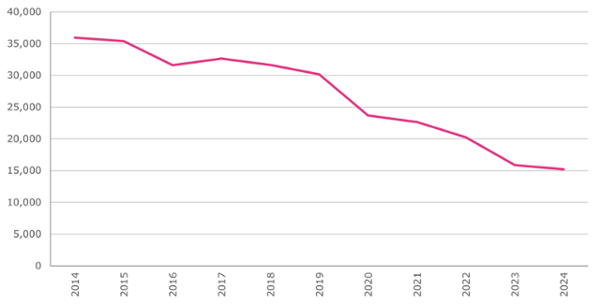
The number of survey respondents has generally fallen across the UK since 2014. The number of respondents across Wales in 2024 was around 15,200 people, compared with around 36,000 in 2014.
Figure 2 APS survey respondents over time, count, Wales, 2014 to 2024
Since the last update of this indicator, data quality issues have come to light with the Annual Population Survey. As a result, the Office for National Statistics has removed the accredited official statistics status from outputs based on this survey. This primarily affects data at lower geographic levels, such as local authorities and health boards. Caution should be taken when interpreting results at those levels. Further information on the change in status can be found via the correspondence regarding the suspension of APS estimates’ accredited status.
Although presented in the trend tab, direct comparisons over time are not possible due to the change in methodology between 2020 and 2023. This is illustrated in the sectioning of the trend chart periods by survey methodology.
Useful links
Welsh Government Lifelong Learning Wales Record (LLWR)
The LLWR is used to estimate the following proportion:
• Labour market status of those engaged in Work Based Learning.
These proportions are then applied to the numbers known to be in education, work-based learning and the total population to derive estimates of participation by education and employment. For Work Based Learners, the labour market status at the start of the learning programme collected via the LLWR is used with the addition of some APS data to estimate the proportions in full-time and part-time employment.
As the data comes from a survey, the results are sample-based estimates and are therefore subject to differing degrees of sampling variability, i.e. the true value for any measure lies in a differing range about the estimated value.
Data is published annually, 2020 data is provisional at this point. The dataset can be accessed via stats wales.
Conception statistics (ONS)
Conception statistics are estimates of all pregnancies of women usually resident in England and Wales. Figures are derived from maternity, birth and abortion notifications. As there are legal requirement to record this data, it is one of the most reliable data sources available. This dataset combined with the ONS mid-year population estimates is used to estimate conception rates per 1,000 females (15-17 year olds) in Wales.
Quality and methodology information
User guide to conception statistics
Public Health Mortality
Public Health Mortality (PHM) is a dataset containing each individual death of a resident that is registered in the particular year. Individual records for death registrations are sent on a weekly basis from the Registrars’ offices across England and Wales to the Office for National Statistics (ONS). The ONS collates and validates the data. The data are based on the underlying cause of death e.g. if an individual dies from pneumonia but had been made vulnerable to that disease by end-stage cancer, then cancer (rather than pneumonia) is recorded as the underlying cause of death.
There have been revisions to the manner in which the death certificates are translated by the ONS into International Classification of Diseases codes (10th revision). These changes mean that unrevised data are not comparable across years. The main change relates to the rules that govern which cause of death detailed on the death certificate is selected as the underlying cause. Comparability ratios have not been used in these analyses and therefore caution should be exercised when interpreting trends.
Cause of death is based on the medical certificate of cause of death. This is completed by the certifying doctor for about three quarters of deaths and by a coroner for the remainder. Most of the deaths certified by a coroner do not involve an inquest or any suspicion of violence, but are referred to the coroner because they were sudden and unexpected, or because there was no doctor in attendance during the deceased’s last illness. There will be a long delay in registering a small number of deaths for which a coroner’s ruling is required e.g. suicide, homicide, undetermined intent.
Please note that suicides have been counted by date of registration. There is a known delay between date of occurrence and the date of registration; further delays are likely as a result of the coronavirus pandemic. Please be aware that data is likely to be incomplete, particularly for the most recent periods. See ONS for more information:
Hazards and licences data collection, Welsh Government (WG)
This dataset provides information on the condition of residential properties assessed by local authorities under the Housing Health and Safety Rating System (HHSRS), including the number of hazards by hazard type, dwelling and category. Category 1 hazards are considered high risk and where a condition is classified as Category 1, the local authority has a duty to take the appropriate enforcement action. Category 2 hazards are lower risk, and local authorities may take enforcement action. Assessments may be carried out for a number of reasons. For example, an HHSRS assessment is carried out when licensing a house in multiple occupation or when a complaint about a property is received from the occupier or a neighbour. Whilst it can cover all residential premises, it is more commonly used to assess standards in private rented housing. Dwellings can be assessed more than once during each reporting period.
The quality of housing indicator is defined as the percentage of assessments which are free from category 1 hazards according to the Housing Health and Safety rating system hazards. It does not cover all dwellings but just those that are assessed by local authorities.
Note that, due to the Coronavirus (COVID-19) pandemic in 2020, data on housing hazards and licences in Wales for 2019-20 were not collected.
Occasionally a local authority is unable to provide data for a variety of reasons. The table below lists instances of this:
|
Data Collection Period |
Area |
Reason for missing data |
Result |
|---|---|---|---|
|
2023 - 2024 |
Neath Port Talbot |
2021 - 2022 data used as an estimate |
|
|
2022 - 2023 |
Neath Port Talbot |
2021 - 2022 data used as an estimate |
|
|
2022 - 2023 |
Gwynedd and Isle of Anglesey |
|
Resubmitted data due to corrections |
|
2021 - 2022 |
Pembrokeshire |
2020 – 2021 data used as an estimate |
|
|
2020 - 2021 |
Wales |
COVID-19 pandemic |
Fewer inspections carried out; higher-risk premises prioritised |
|
2019 - 2020 |
Wales |
COVID-19 pandemic |
No data collected |
|
2018 - 2019 |
Neath Port Talbot |
Estimated figure calculated based on previous 3 years |
|
|
2017 - 2018 |
Cardiff |
2016 - 2017 data used as an estimate |
|
|
2016 - 2017 |
Wrexham and Denbighshire |
Changes to data recording systems |
2015 - 2016 data used as an estimate |
|
2014 - 2015 |
Flintshire |
2013 - 2014 data used as an estimate |
Department for Environment Food and Rural Affairs (DEFRA) & UK Air Information Resource (AIR)
Air Quality Exposure Indicators - average NO2, PM2.5 and PM10 concentrations across local authority areas and health board areas, derived from modelled data for each square kilometre in Wales, measured in µg/m3 (DEFRA data).
Each year the UK Government’s Pollution Climate Mapping (PCM) model calculates average pollutant concentrations for each square kilometre of the UK. Each year the Pollution Climate Model (PCM) which underpin the background maps is refined and improved (to account for latest available science and understanding e.g. changes in emissions factors, improved activity data etc.). These method changes are usually only applied in the latest year's figures.
The model is calibrated against measurements taken from the UK’s national air quality monitoring network. The Welsh Government has used this published data to assign a concentration of NO2, PM2.5 and PM10 to each residential dwelling in Wales based on which square kilometre of Wales it sits in.
For each census output area (statistical geographic units comprising around 150 properties), the pollutant concentrations associated with each dwelling within it were averaged to give an average NO2, PM2.5 and PM10 concentration across the census output area.
The quality of air we breathe indicator in this tool is defined as the annual average nitrogen dioxide (NO₂) concentration levels at residential dwelling locations (µg/m³).
National Community Child Health Database (NCCHD)
The National Community Child Health Database (NCCHD) includes details relating to maternal and child health related indicators such as births, immunisation screening, safeguarding children and breastfeeding.
Each of the seven health boards in Wales has a Child Health System database which they manage locally. Anonymised records for all children born, resident or treated in Wales and born after 1987 are collated from each of the local databases each quarter to create the NCCHD.
The statistics relate to live births born to Welsh residents during the relevant calendar year. The analyses are for live births only and do not include stillbirths. Births occurring in Wales (whether to Welsh or non-Welsh residents) can also be counted by the NCCHD but only Welsh residents are included in these statistics.
The ‘low birth weight’ and ‘breastfeeding at 10 days’ indicators are created using this dataset.
Breastfeeding data has been suppressed if it is less than 80% complete.
To note breastfeeding also includes chestfeeding.
School Health Research Network (SHRN)
The School Health Research Network (SHRN) is a partnership between Welsh Government, Public Health Wales, and Cardiff University established in 2013. They aim to improve young people’s health and wellbeing in Wales by working with schools in both primary and secondary education to generate and use good quality evidence for health improvement. This includes surveys, capturing key health and wellbeing metrics. These metrics are referenced in many national policies and strategies, including the Whole School Approach to Mental Health and Wellbeing (2021) and Estyn’s Healthy and Happy Report (2019).
Since 2017, all mainstream secondary schools in Wales have become registered SHRN members with over 90% of schools completing SHRN’s Student Health and Wellbeing Survey in 2021/22.
The definition for the healthy weight indicator has changed to only include children reporting a 'healthy range' BMI category. The previous definition included children reporting either 'underweight' or 'healthy range' BMI categories. The indicator is therefore not comparable to data published in the 2021 SHRN national report. Calculation of healthy weight indicator:
|
Characteristic |
'Healthy' BMI range |
|
11 year old, male |
>=15.15 to <20.85 |
|
11 year old, female |
>=15.30 to <21.12 |
|
12 year old, male |
>=15.59 to <21.54 |
|
12 year old, female |
>=15.91 to <22.05 |
|
13 year old, male |
>=16.11 to <22.24 |
|
13 year old, female |
>=16.55 to <22.90 |
|
14 year old, male |
>=16.68 to <22.95 |
|
14 year old, female |
>=17.16 to <23.60 |
|
15 year old, male |
>=17.26 to <23.59 |
|
15 year old, female |
>=17.68 to <24.13 |
|
16 year old, male |
>=17.79 to <24.18 |
|
16 year old, female |
>=18.08 to <24.53 |
Maternity Indicator Data set (MIds)
Statistics on smoking at birth are limited by the way in which the data is collected. If carbon monoxide (CO) monitoring is not available, data reliability is dependent on the mother self-reporting accurate information. CO monitoring has largely been suspended since the COVID-19 pandemic began, so data for 2020 and 2021 is mainly self-reported.
E-Cigarette use should not be recorded in this data item and would not be detected by a CO monitor; however, in practice some mothers may self-report as a smoker if they use e-cigarettes and be incorrectly recorded as a smoker. Likewise, some mothers who do smoke may self-report as a non-smoker and be incorrectly recorded as a non-smoker.
In 2021, 82% of records had valid data recorded at the Wales level. This was largely due to Hywel Dda health board not supplying any smoking at birth data, while there was only 68% complete data for Cwm Taf Morgannwg. There were also low levels of completeness in 2020 for Hywel Dda (30%), Cwm Taf Morgannwg (70%) and Powys (76%). However, in all years prior to 2020, more than 90% of records had valid data for smoking status at birth, across nearly all health boards.
Full details of every data item available on both the Maternity Indicators dataset and National Community Child Health Database are available through the NWIS Data Dictionary.
More detailed information on the sources of data and analyses in this statistical release are provided in the quality report.
Stats Wales data.
Registration and Population Interaction Database (RAPID)
The Registration and Population Interactive Database (RAPID) provides a single coherent view of citizens’ interactions with Department for Work and Pensions (DWP) and HM Revenue and Customs (HMRC) within a tax year for the UK. RAPID provides a basis for analyses of children, the family unit, and gross personal incomes (benefits/tax credits, employment, self-employment, occupational pensions) from which estimates of the number of children in low income families can be derived calibrated to HBAI regional estimates on Absolute and Relative definitions.
The children in poverty indicator presented in PHOF uses relative low income, which measures the number and proportion of children (aged 0-15) in households below 60 per cent of the UK average income, before housing costs are paid. Please note that this differs from the Wellbeing of Future Generations national indicator which measures the proportion of children living in poverty after housing costs are paid. Percentages are calculated using ONS mid-year population estimates.
Basing the indicator on income "before housing costs" may understate poverty levels compared to “after housing costs”, however, the latter data are not currently available at subnational level.
Data for financial years 2020/21, 2021/22 and 2022/23 have been impacted by the Covid-19 pandemic. Following concerns about the quality of 2020/21 estimates, these have been suppressed in the PHOF dashboard.
From the June 2025 publication onwards, figures are calibrated to single-year Households Below Average Income (HBAI) UK estimates, replacing the previous approach using two- or three-year averages. This change results in a revised back-series and means the data is not directly comparable with earlier publications.
Further information on the impact of the Covid-19 pandemic on these statistics can be found in the children in low income technical report.
COVER - National childhood immunisation uptake data
Data is received from the preventable disease programme and communicable disease surveillance centre. The number of children who received the scheduled vaccinations is divided by the number of children aged 4 multiplied by 100. This measure is calculated using appropriate booster immunisation or final course doses. Figures are calculated for children living and resident in Wales as at the end of March in each year.
Latest quarterly data report.
Immunisation and vaccines resource page.
NHS Wales Dental Epidemiological Programme
The Dental Epidemiology Programme for Wales measures the extent, severity and impact of dental disease for Year 1 children (5-year-olds), Year 7 children (12-year-olds) and adult groups living across Wales.
Public Health Wales is responsible for the coordination of the Dental Epidemiology Programme for Wales. We are responsible for the design, conduct and delivery of the programme, working alongside the Welsh Oral Health Information Unit. The Community Dental Services in every health board across Wales participate in the programme.
Dental caries experience (d3mft) was defined as one or more teeth with visually obvious dentinal decay (d3t); a tooth judged to have been extracted due to caries (mt); or a tooth with a restoration (ft). The 2022/23 inspection was the first since the coronavirus (COVID-19) pandemic. Children examined as part of this inspection were born in the 2016/17 academic year and so would have been two-to-three years of age in March 2020. To fully assess the impact of the COVID-19 pandemic on the prevalence and severity of dental caries in Wales, another inspection of school year one children is recommended for the academic year 2024/25.
For 2022-23 insufficient examinations were conducted in Ceredigion County Council area of Hywel Dda University Health Board and therefore estimates for these areas are not available for this period. Estimates for Wales for this period do not include Ceredigion County Council area and should be interpreted cautiously.
Other key data sources:
Welsh Index of Multiple Deprivation 2019 (WIMD) (used to calculate fifths of deprivations). It is the Welsh Government’s official measure of relative deprivation for small areas in Wales. It is made up of eight separate domains/types of deprivation.
ONS Mid-year estimates (MYE) are the official source of population sizes, produced annually, covering populations of local authorities, counties, regions and countries of the UK by age and sex. This data source is used as the denominator when calculating crude and age-standardised rates.
Table 1 Indicator changes responding to user input.
| Date of change | Indicator name | Previous description | New description | Reason for the change |
|
12th July 2024 |
Children living in poverty |
Children living in poverty after housing costs |
Children living in poverty before housing costs | Following user feedback on the usability of the data. We’re now able to show data at local authority and health board breakdowns. |
| 12th July 2024 |
Adolescents of healthy weight |
Percentage of children reporting either 'underweight' or 'healthy range' BMI categories. | Percentage of children reporting a 'healthy range' BMI category | Following user feedback that it wasn’t appropriate to include ‘underweight’ BMI category data. |
Please find guidance on how to interpret the following terms used in the tool:
- Confidence intervals
Confidence intervals show the natural variation that would be expected around a rate. The wider the confidence interval, the more the rate would be expected to vary over time by chance alone. If the confidence intervals are relatively wide, this makes it harder to draw conclusions about the difference in rate between area X and area Y, or the change in area X over time.
The size of the confidence interval is dependent on the number of events occurring and the size of the population from which the events came. Generally speaking, rates based on small numbers of events and small populations are likely to have wider confidence intervals, indicating greater uncertainty. Meanwhile, rates based on large populations are likely to have narrower confidence intervals, indicating greater precision.
In the Public Health Outcomes Framework reporting tool, we use 95 per cent confidence intervals. This represents a range of values that we can be 95 per cent confident contains the ‘true’ underlying rate within the population.
- Making comparisons: statistical significance
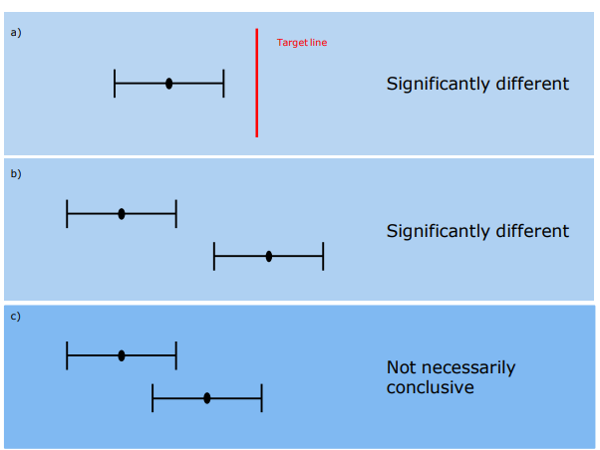
Comparisons are often made between two or more estimates, for example between different areas or time periods (Figure 1). In such cases, we need to test whether the differences are ‘statistically significant’, i.e. unlikely to be due to the play of chance alone.
There are different ways of testing for statistical significance:
1. Comparing the confidence intervals of the estimates to see if they overlap. Non-overlapping confidence intervals are considered to be statistically significantly different (Figure 1b). Whilst it is safe to assume that non-overlapping confidence intervals indicate a statistically significant difference, overlapping confidence intervals are inconclusive (Figure 1c) and would require a further statistical test as described in point 2 below.
2. Calculating the ratio of the two estimates, or the difference between them, and constructing a test or confidence interval around that figure. Such methods are not covered in this technical guide, but can be found in a standard textbook.
3. Observing whether the confidence interval of the local area estimate (e.g. Carmarthenshire) touches the estimate for Wales (Figure 1a), which is treated as a ‘Target’ value. This is the chosen method for establishing statistical significance within the ‘Comparison table’ section of the PHOF reporting tool, due to being relatively simple to calculate and to understand.
Figure 1. Using confidence intervals for making comparisons a) & b) Non- overlapping confidence intervals are considered as statistically significant c) Overlapping confidence intervals do not always indicate a difference that is not statistically significant
- Local and national deprivation fifths
The Welsh Index of Multiple Deprivation (WIMD) is an official measure of relative deprivation for small areas in Wales and a National Statistic. It identifies areas with the highest concentrations of deprivation. Ranking these areas, and dividing them into five equally sized groups produces fifths of deprivation.
For all national level analysis and most of the analysis at health board and local authority, fifths are calculated at the Wales level (national fifths). There are some indicators where local fifths are used, specifically the life expectancy and healthy life expectancy. Local fifths differ from the national fifths in that the five equal bands of deprivation are recalculated just for the small areas within each health board and local authority boundary, rather than inheriting the national fifths. This is useful for a more localised approach to producing health expectancies.
- Revised European Standard Population 2013 is a hypothetical population structure used in the weighting of mortality or incidence data to produce age-standardised rates (ASR’s).
-
National Indicators (NI) represent the outcomes for Wales, demonstrating progress towards seven well-being goals. There are 50 NI's in total, ten are reported in the Public Health Outcomes Framework.
The Evidence Service produces systematic reviews, evidence maps and rapid summaries, on various health topics, which may support findings in this tool.
What’s available in other UK nations?
Across the UK nations there are similar tools to the Welsh Public Health Outcomes Framework, none of which are wholly comparable.
In England, the Public Health Outcomes Framework (PHOF) is made up of four domains and is produced by the Office for Health Improvement & Disparities. The domains making up the English PHOF include wider determinants, health improvement, health protection and healthcare and premature mortality. Almost 200 indicators populate the domains, most, but not all differ from those presented in the Welsh version.
Northern Ireland don’t produce a Public Health Outcomes Framework. However, they have developed a Public Health strategy called ‘Making Life Better a whole system strategic framework for Public Health’. The strategy is broken into six themes, including ‘giving every child the best start, equipped throughout life, empowering healthy living, creating the conditions, empowering communities and developing collaboration.
Scotland don’t produce a Public Health Outcomes Framework, however Public Health Scotland and its predecessor bodies have adopted outcome planning approaches across national policy and as such have produced National Performance Framework and National health wellbeing and outcomes framework, both include public health outcome indicators.
Stakeholder engagement
Public Health Wales works closely with stakeholders from local public health teams and Welsh Government to produce this reporting tool. Developed in an agile way, we meet our stakeholders regularly to agree how the reporting tool looks, is navigated and indicators are broken down.
We’re always trying to improve the reporting tool, and so any feedback can be emailed to Observatory.AnalyticalTeam@wales.nhs.uk.
This accessibility statement applies to the Public Health Outcomes Framework (PHOF) Dashboard.
This is run by Public Health Wales. We want as many people as possible to be able to use this website. For example, that means you should be able to:
- zoom in up to 300% without the text spilling off the screen
- navigate most of the website using just a keyboard
- navigate most of the website using speech recognition software
- listen to most of the website using a screen reader (including the most recent versions of JAWS, NVDA and VoiceOver).
We have also made the website text as simple as possible to understand. AbilityNet has advice on making your device easier to use if you have a disability.
Accessibility on this website is guided by government standards and the Web Content Accessibility Guidelines (WCAG). WCAG are widely accepted as the international standard for accessibility on the web.
Whilst we aim to make this website accessible to all users and achieve a WCAG conformance level 'AA'; we continually work with stakeholders to ensure that conformance level 'A' is adhered to as a minimum.
The Recite Me translation and text-to-speech features on this website are automated. There may be inaccuracies and inconsistencies in the translations. The official text is the English/Welsh version of the website. If you experience any accessibility issues on this site or have any comment, please contact us.
How accessible this website is
Version 7, published 12/07/2024
We know some parts of this website are not fully accessible:
- Parts of some pages may not work well with Assistive Technologies such as screen readers
- Some menus are not fully accessible
- Some buttons and links do not have accessible descriptions
- Some pages are not fully usable with the keyboard
- Some pages have an illogical focus order
Feedback and contact information
If you need information on this website in a different format like accessible PDF, large print, easy read, audio recording or braille, please contact us in the first instance and we will pass your request onto the relevant team. We will consider your request and get back to you in 10 working days.
Reporting accessibility problems with this website
We are always looking to improve the accessibility of this website. If you find any problems not listed on this page or think we are not meeting accessibility requirements, please contact us.
Enforcement procedure
The Equality and Human Rights Commission (EHRC) is responsible for enforcing the Public Sector Bodies (Websites and Mobile Applications) (No. 2) Accessibility Regulations 2018 (the ‘accessibility regulations’). If you are not happy with how we respond to your complaint, contact the Equality Advisory and Support Service (EASS).
Technical information about this website's accessibility
Public Health Wales is committed to making its website accessible, in accordance with the Public Sector Bodies (Websites and Mobile Applications) (No. 2) Accessibility Regulations 2018.
Compliance status
This website is partially compliant with the Web Content Accessibility Guidelines version 2.2 AA standard, due to the non-compliances and exemptions listed below.
Non-accessible content
The content listed below is non-accessible for the following reasons.
Non-compliance with the accessibility regulations
Version 7, published 12/07/2024
Whilst we endeavour to meet ‘WCAG 2.2 AA’ we currently have the following non-compliance issues:
1.1 Text alternatives
1.1.1 Non-text Content
1.3 Adaptable
1.3.1 Info and Relationships
1.3.2 Meaningful Sequence
1.3.3 Sensory Characteristics
1.3.5 Identify Input Purpose
1.4 Distinguishable
1.4.1 Use of Colour
1.4.3 Contrast (Minimum)
1.4.8 Visual Presentation
2.1 Keyboard Accessible
2.1.1 Keyboard
2.4 Navigable
2.4.3 Focus Order
2.4.4 Link Purpose
2.4.6 Headings and Labels
3.1 Screen reader accessibility
3.1.1 Language of Page
3.3 Input assistance
3.1.1 Redundant Entry
4.1 Compatibility
4.1.2 Name, Role and Value
Preparation of this accessibility statement
This statement was prepared in July 2024. It will be reviewed in July 2025.
This website was last tested in June 2024 by ourselves using the FastPass Accessibility Insights for Web extension.
APS (Annual Population Survey - managed by ONS)
CDSC (Public Health Wales Communicable Disease Surveillance Centre)
CMP (Child Measurement Programme - managed by Digital Health Care Wales)
DEFRA (Department for Environment, Food and Rural Affairs - managed by WG)
DHCW (Digital Health and Care Wales)
DWP (Department for Work and Pensions)
FPF (Foundation Phase Framework - managed by Welsh Government)
HBMD (Health Board Maternity Dataset - managed by DCHW)
HBSC (Health Behaviour in School-aged Children study)
HLCC (Hazards and licences data collection - managed by Welsh Government)
HMRC (HM Revenue and Customs)
LFS (Labour Force Survey - managed by ONS)
NCCHD (National Community Child Health Database, managed by DHCW)
NSW (National Survey Wales - managed by Welsh Government)
ONS (Office for National Statistics)
PEDW (Patient Episode Database Wales - managed by DHCW)
PHM (Public Health Mortality - managed by ONS)
SHRN (School Health Research Network)
SW (StatsWales - managed by Welsh Government)
VPDP (Vaccine Preventable Disease Programme - managed by CDSC)
WDS (Welsh Dental Survey - managed by Welsh Oral Health Information Unit)
WED (Welsh Examinations Database - managed by Welsh Government)