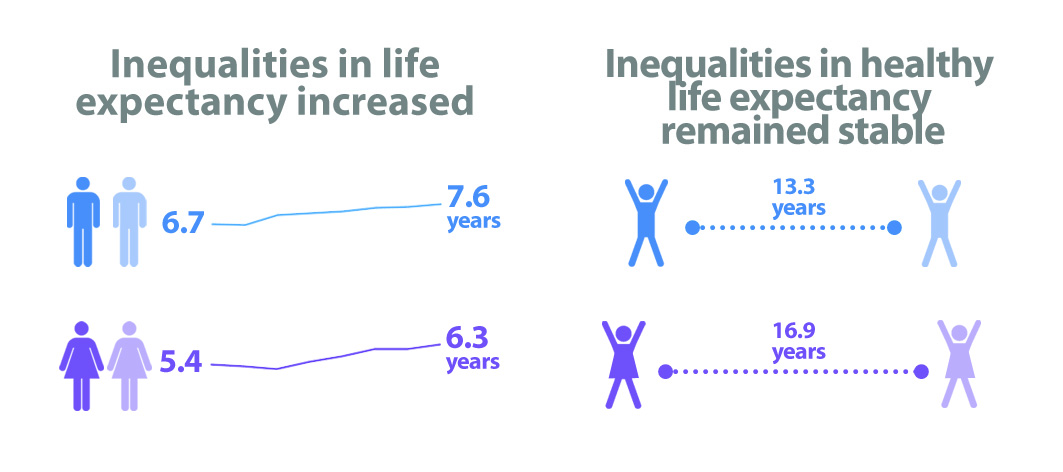
Inequalities in life expectancy increased while inequalities in healthy life expectancy remained stable.
Published: 09 June 2022
Key messages
- Deaths were notably higher in 2020 due to COVID-19 and will impact upon life expectancy estimates.
- Life expectancy in Wales was 82 years for females and 78 years for males in 2018-2020.
- Life expectancy for females was at its lowest point in 2018-2020 since the start of the reporting period (2011-2013).
- Healthy life expectancy was 62 years for females and 61 years for males in 2018-2020.
- Males spend more of their life in good health (78.5%) compared to females (76.0%).
- The gap in life expectancy between the least and most deprived population in Wales has been generally increasing in recent years for males and females, suggestive of growing inequality. The inequality gap was over a year greater for males than in females.
- The gap in healthy life expectancy has remained relatively stable between 2011-2013 and 2018-2020 for males and females. The gap in females was over three and a half years larger than for males.
- While there have been some signs that the gap in males has decreased since 2015-2017, there was an increase in the gap in healthy life expectancy by 2.2 years for females over the same period.
Click here to view the Health expectancies in Wales with inequality gap profile
Insight
Higher mortality rates in 2020 due to the COVID-19 pandemic may account for some of the worsening life expectancy estimates seen in 2018-2020. However, a stalling in life expectancy improvement was previously reported prior to the pandemic as part of Life expectancy and mortality in Wales 2020. Some possible explanations cited for worsening health expectancies and widening inequalities include low wage growth, fuel poverty, food insecurity, and the period of austerity in Wales since 2010/11 as highlighted by Sir Michael Marmot 1. The recent rise in the cost of living is an additional pressure which may further increase inequalities in health expectancies as lower income households may not be able to afford basic necessities such as food and heating to maintain a decent standard of living.
‘A More Equal Wales’ is one of the seven goals of the Well-being of Future Generations (Wales) Act 2015. Life expectancy, healthy life expectancy and their inequality gaps are important indicators to help measure inequalities in health and are included in the Public Health Outcomes Framework.
About the method
Health expectancies
Life expectancy is a measure of the average expected years of life for a newborn based on recently-observed mortality rates. Healthy life expectancy represents the number of years a person might expect to live in good or very good health. Both measures are estimates for the general population.
The gap in health expectancies is calculated as the absolute difference between the least and most deprived fifths. This is a change of method since previous health expectancies releases, to improve the stability of the measure at local authority level. The gap was previously calculated using the Slope Index of Inequality (SII). ONS continue to publish the SII at national level as part of their HLE release. It is important to remember that health boards and local authorities which contain more extreme differences in deprivation levels will inevitably result in wider gaps in health expectancies, compared to areas which are more socio-economically similar.
Further details on the absolute difference method and its comparison with the SII can be found in this document. While the gap is a useful measure of inequality between the least and most deprived, it is important to consider all the measures of health expectancy.
 Download technical report (.pdf)
Welsh Index of Multiple Deprivation
Health expectancies by deprivation are calculated using Welsh Index of Multiple Deprivation 2019 which is the Welsh Government’s official measure of relative deprivation for small areas in Wales. For Wales-level health expectancies, national fifths of deprivation are used where all the small areas in Wales are split between five equal bands of deprivation. Health board and local authority figures use local fifths of deprivation. Local fifths differ from the national fifths in that the five equal bands of deprivation are recalculated just for the small areas within each health board and local authority boundary, rather than inheriting the national fifths. This is useful for a more localised approach to producing health expectancies.
Data Considerations
Healthy life expectancy combines life expectancy with self-reported good health survey data. Responses to questions on health status is subjective. Additionally, there were some gaps in the survey data which required adjustment, particularly at the local authority level.
1 Marmot, M., Allen, J., Boyce, T., Goldblatt, P., Morrison, J. (2020). Health equity in England: The Marmot Review 10 years on. London: Institute of Health Equity.
Click here to view the Health expectancies in Wales with inequality gap profile
Get in touch
We are always looking to improve on the products we produce to ensure that they are user-friendly. If you have any comments or feedback, then please get in touch with us by emailing: publichealthwalesobservatory@wales.nhs.uk