Diabetes prevalence – trends, risk factors, and 10-year projection
Rhys Powell, Publichealthwalesobservatory@wales.nhs.uk
Date published: 14 November 2023
Headlines
Since 2009/10 the number of adults aged 17 years or older living with diabetes has increased by 40% to 212,716 in 2021/22 (Quality Outcomes Framework, QOF, 2018/19 and Quality Assurance and Improvement Framework, QAIF, 2021/22, Welsh Government).
If current trends continue, by 2035/36, we estimate that around 1 in 11 adults (17+ years old) will be living with diabetes in Wales. This is 260,000 people, an increase of nearly 48,000 people (22%) compared with 2021/2022.
This stark picture of diabetes in Wales is driving our priorities. We are working with our partners across the system to bring together the evidence base for action to tackle diabetes and support people living with diabetes. This includes a focus on prevention. Therefore, the ambition of the public health system is to build on its existing range of programmes to:
-
turn the corner and stop the increasing prevalence of Type 2 diabetes
-
have more people living well with diabetes as measured through a reduction in amputations and other diabetes pathways.
We will share more information on this programme as it progresses.
On these pages
-
analysis: latest prevalence for diabetes and its risk factors in Wales, and 10-year projections
-
actions: summary of the actions the public health system in Wales is currently taking to deal with diabetes and its risk factors
-
individuals: information for individuals on the symptoms, treatment and prevention of diabetes can be found on our diabetes topic page
-
data: download the data in this article.
Sections
1. What is diabetes?
Type 1 diabetes accounts for about 8% of UK cases (How many people in the UK have diabetes? 2021/22, Diabetes UK). It is a lifelong condition, where the body’s immune system attacks and destroys the cells that produce insulin. Insulin helps control the body’s energy supply. For Type 1 diabetes, there are only limited lifestyle changes that you can make to lower your risk.
Type 2 diabetes accounts for around 90% of UK cases (How many people in the UK have diabetes? 2021/22, Diabetes UK). In Type 2 diabetes, the body does not produce enough insulin, or the body’s cells do not react to insulin properly. You can reduce the risk of getting Type 2 diabetes through healthy eating, regular exercise and achieving a healthy body weight. It may also be possible to put Type 2 diabetes into remission by weight loss.
Other, rarer forms of diabetes make up the remaining 2%.
Our diabetes topic web page has more information on diabetes, its symptoms and treatment.
More information for people living with or at risk from diabetes:
-
Public Health Wales’ diabetes topic web page - more information on diabetes, its symptoms and treatment
-
Know Your Risk - a tool to find out your level of risk of developing Type 2 diabetes
-
Let’s prevent diabetes - for anyone who is at risk of developing Type 2 diabetes and would like to know more
-
MyDESMOND - a diabetes self-management digital platform free to access for everyone in Wales who lives with Type 2 diabetes.
2. Diabetes prevalence
In 2021/22, almost one in 12 people aged 17+ years were diagnosed with Type 1 or Type 2 diabetes in Wales (8.0%). Prevalence varies by Health Board (Figures 1 and 2). Some of that variation will reflect differences in the age and sex profiles of the Health Board populations. For example, Cardiff’s relatively young population is a factor in its relatively low prevalence. Deprivation is also a factor in diabetes prevalence.
Diabetes prevalence is higher in older people, and for males across all age groups (Figure 3). In 2021/22 there were more than 210,000 adults (17+ years old) living with diabetes in Wales.
There has been a steady increase in the number of adults with diabetes in Wales, an increase of almost 60,000 people (40%) over a period of 12 years to 2021/22 (Figure 4). This increase is mostly due to an increase in Type 2 diabetes.
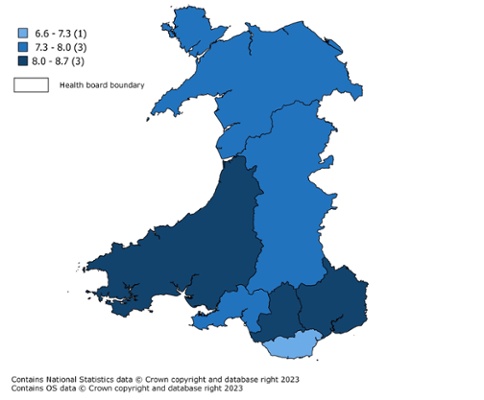
Figure 1: percentage of registered patients aged 17+ years with diabetes in Wales, by Health Board. Cardiff and Vale University Health Board have the lowest rate, 6.6%, and Aneurin Bevan University Health Board the highest, 8.7%. Note that these rates have not been adjusted for age or sex, and differences between the Health Boards will in part be due to differences in population profiles. QAIF, 2021/22, Welsh Government
| Area | Prevalence / percent of population aged 17+ |
|---|---|
| Aneurin Bevan UHB | 8.7 |
| Cwm Taf Morgannwg UHB | 8.6 |
| Hywel Dda UHB | 8.4 |
| Betsi Cadwaladr UHB | 7.9 |
| Powys THB | 7.8 |
| Swansea Bay UHB | 7.8 |
| Cardiff and Vale UHB | 6.6 |
| Wales | 8.0 |
Figure 2: percentage of registered patients aged 17 years and older with diabetes in Wales, by Health Board, QAIF 2021/22, Welsh Government
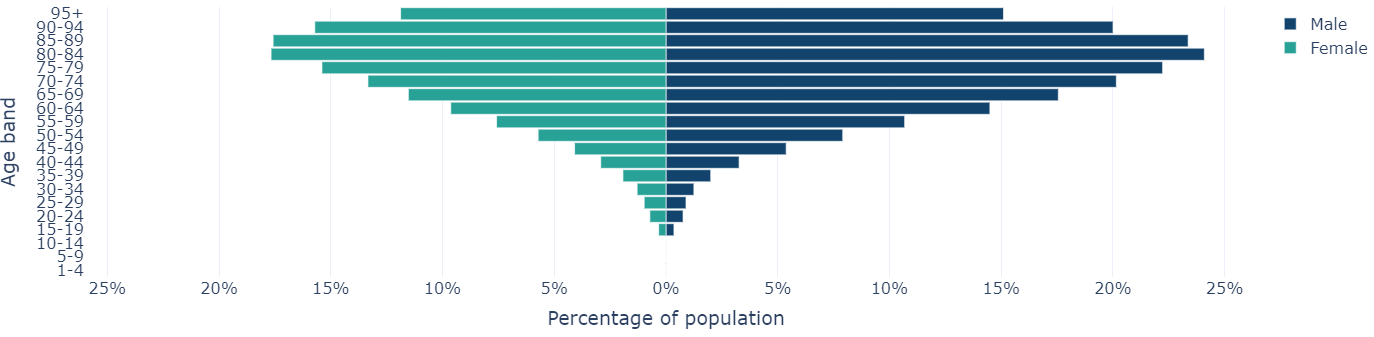
Figure 3: diabetes prevalence is higher in older people, and for males. QAIF, 2021/22, Welsh Government
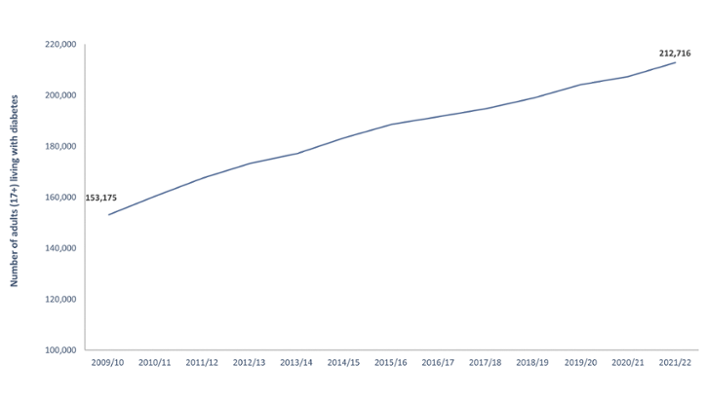
Figure 4: the number of adults (17+) living with diabetes in Wales increased by nearly 60,000 people between 2009/10 and 2021/22. This is an increase of almost 40%. QOF, 2018/19 and QAIF, 2021/22, Welsh Government
3. The impact of diabetes on the NHS
Diabetes cost the UK almost £14 billion in 2021/22, including more than £10 billion in direct costs to the NHS, according to the findings of the York Health Economics Consortium (Estimation of the direct health and indirect societal costs of diabetes in the UK using a cost of illness model).
Spending on prescriptions
The cost and volume of medicines prescribed for the treatment of diabetes has been steadily increasing over the last 10 years with 12.8% of the total medicines’ expenditure in NHS Wales being medicines used in diabetes compared to 9.8% in 2014/15 (Primary Care Prescribing Analysis – Medicines Used in Diabetes, AWTTC). The cost of drugs is routinely described using the net ingredient cost (NIC) measure. NIC is the cost of the drug before discounts and does not include any dispensing costs or fees. According to data from the Welsh Analytical Prescribing Unit, between 2018/19 and 2023/24 the NIC of prescriptions in relation to diabetes rose by 56 per cent from £57.8 million to £90.4 million, see figure 5.
The increase in prescribing costs has in part been driven by an increase in prescribing volume. In 2023/24 the number of items prescribed and subsequently dispensed in the community in relation to medicines used for the treatment of diabetes was reported to be 4 million. This is an increase of 0.8 million items (25%) compared to 2018/19 (assuming 3.2m items in 2018/19), see figure 5.
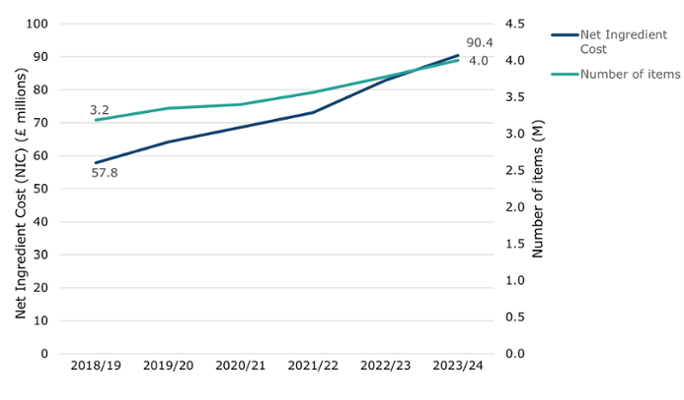
Figure 5, net ingredient cost and number of items prescribed for the treatment of diabetes (Welsh Analytical Prescribing Support Unit, All Wales Therapeutics and Toxicology Centre)
Hospital admissions
People living with diabetes are more likely to be admitted to hospital than those without. Across all ages, around 1 in 15 people in Wales are living with diabetes. But, in 2021/22, more than one in ten inpatient admissions (11%) were to patients with diabetes (’this includes admissions where diabetes or diabetes related complications were not the main diagnosis). In 2019/20, more than one in five of all hospital admissions for people aged 65 years or older included diabetes as a primary or secondary diagnosis (Patient Episode Database Wales, Digital Health and Care Wales). According to NHS Wales internal unvalidated management data there were over 90,000 diabetes related admissions in NHS Wales in 2021/22.
Complications of diabetes – lower limb amputations
Diabetes can cause many complications resulting in loss of vision, kidney failure, heart attack, stroke and limb amputations (Complications of Diabetes 2017). Limb loss is a serious complication, with mortality rates post amputation worse than those for most cancers (Five year mortality and direct costs of care for people with diabetic foot complications are comparable to cancer). According to research published in 2019, the cost of health care for ulceration and amputation in diabetes in 2014-2015 for NHS England was estimated at between £837 million and £962 million. This represents 0.8% to 0.9% of the National Health Service (NHS) budget for England. More than 90% of expenditure was related to ulceration, and 60% was for community, outpatient and primary care settings. For inpatients, analysis suggested that ulceration was associated with a length of stay 8 days longer than that for diabetes admissions without ulceration (The cost of diabetic foot ulcers and amputations to the NHS in England).
The National Diabetes Audit gathers data on major (above the ankle) and minor (at or below the ankle) lower limb amputations. Since the number of amputations undertaken in Wales are low, trends should be interpreted with caution. The trend for major limb amputations in people living with Type 1 diabetes remained steady between 2009 and 2022 ranging from between 15 and 30 procedures each year in Wales. Over the same period, the trend for minor amputations was also stable ranging from 30 to 65 procedures each year in Wales. For people living with Type 2 diabetes the combined risk rate has remained fairly stable over the last decade or so. The number of major amputations has fallen since a peak in 2019. The number of reported major and minor amputations rose between 2009 and 2013. Changes to clinical practices, with the centralisation of vascular services, will have had an impact on data quality over this period, and the increase largely reflects an increase in the proportion of procedures reported, rather than an increase in the true underlying risk rate.
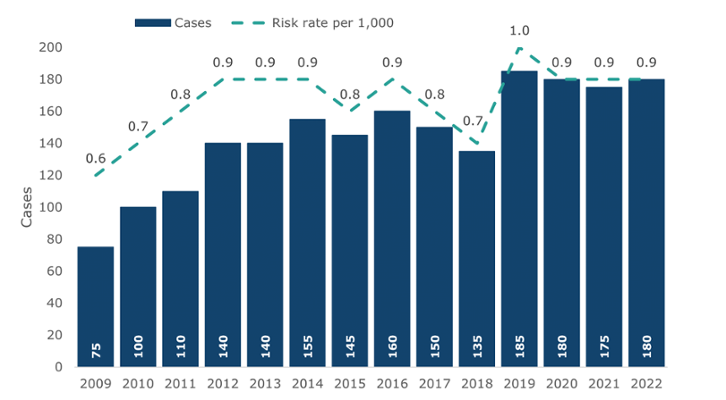
Figure 6 Major lower limb amputations, number of cases, risk rate per 1000, Type 2 diabetes, Wales (Source: National Diabetes Audit)
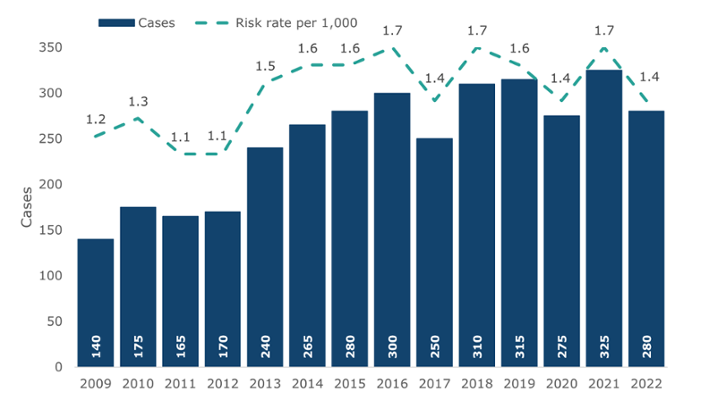
Figure 7 Minor lower limb amputations, number of cases, risk rate per 1000, Type 2 diabetes, Wales (Source: National Diabetes Audit)
4. Diabetes mortality
Diabetes has the second highest age-standardised excess mortality, after heart failure and complications (Monthly mortality analysis, England and Wales, July 2023, ONS). Excess mortality is the current mortality rate minus the previous 5-year average mortality rate. An excess mortality indicates that mortality rates are rising. This means that mortality associated with diabetes is rising. In most months since the beginning of 2020, the age-standardised mortality rate with any mention of diabetes but excluding Covid-19, has been higher than the average value of the previous 5 years, excluding 2020 (Figure 8). As these are age-standardised rates, the rising mortality cannot be attributed to the aging population, although there is also likely to be an effect from this in the non-standardised rates. ‘Any mention’ of diabetes means that diabetes is mentioned on the death certificate but may not be the leading cause of death.
Diabetes is also a risk factor for ischaemic (coronary) heart disease, the leading cause of death in Wales, accounting for nearly one in 10 (9.6%) of all deaths in July 2023. (Monthly mortality analysis, England and Wales: July 2023, ONS)
Figure 9 shows that most of that increase has been from an increase in mortality for over-75s in the most deprived areas. However, there are some signs that in the most deprived areas, mortality rates of the under 75s are increasing. All deaths from diabetes for people aged under 75 are considered avoidable, that is, either preventable or treatable, although this will not necessarily be true for deaths with any mention of diabetes, where diabetes may not be the leading cause (Avoidable mortality by Clinical Commissioning Groups in England and Health Boards in Wales: 2001 to 2020, Office for National Statistics).
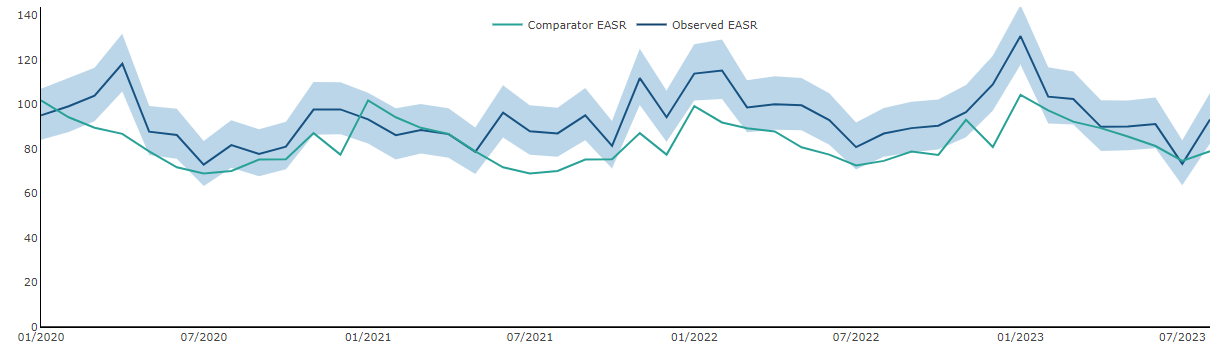
Figure 8: mortality associated with diabetes is increasing. Since July 2021, the observed age-standardised any mention diabetes mortality rate (excluding covid) has been consistently higher than the comparator rate. These are European age-standardised rates (EASR) for mortality with any mention of diabetes, excluding Covid-19. The comparator rate is the mean value for the previous 5 years, excluding 2020. Public Health Mortality, Mid-Year Population Estimates, Office for National Statistics
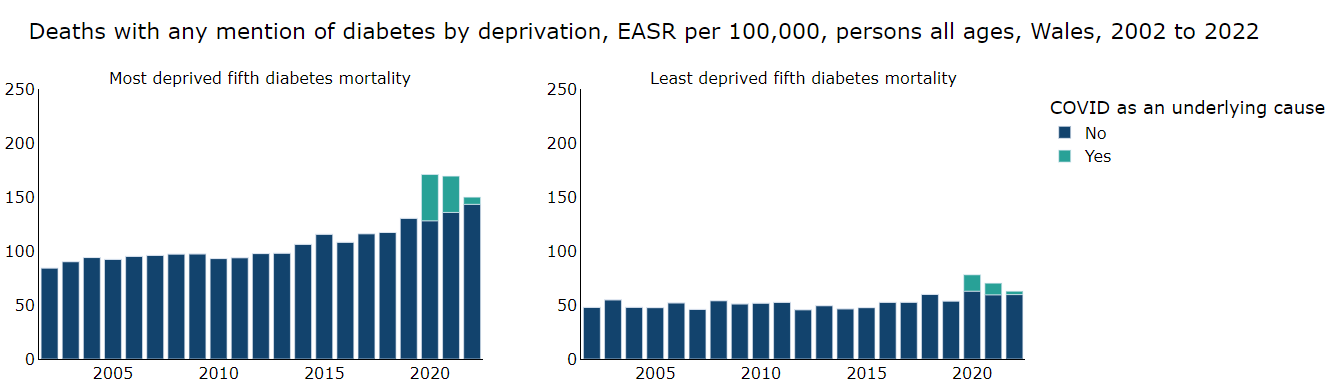
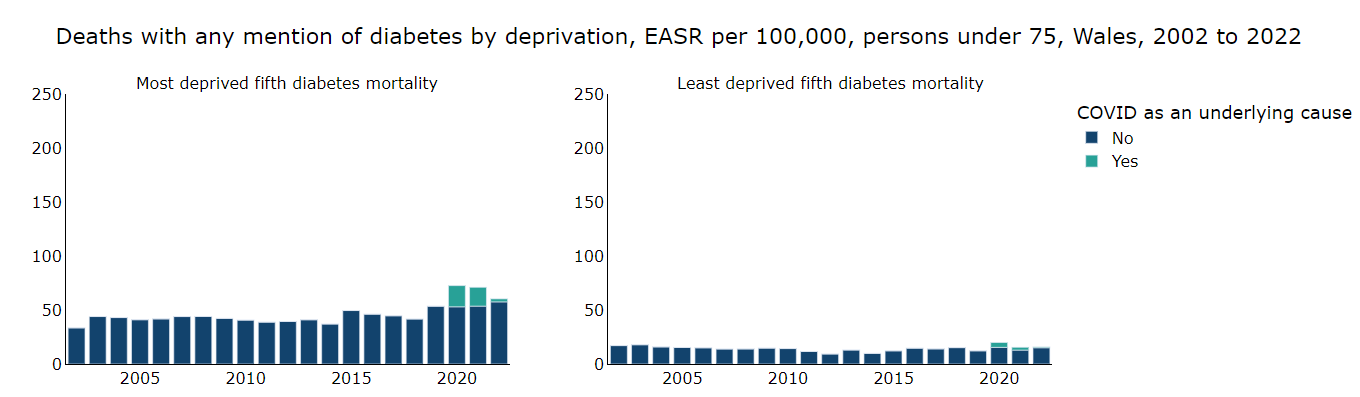
Figure 9: deaths with any mention of diabetes, European age-standardised rates (EASR) per 100,000. Left hand side: most deprived fifth. Right hand side: least deprived fifth. Top: all ages, bottom: under 75 years. Dark blue: Covid-19 is not an underlying cause. Light blue: Covid-19 is an underlying cause of death. The increase in diabetes mortality is less evident in the under-75-year-old population, although there are some signs it is increasing in recent years. Covid-19 does not account for the increase in mortality. The EASR difference between the most and least deprived fifths has more than doubled from 37 per 100,000 in 2002 to 87 per 100,000 in 2022.
5. Diabetes projections
Our central estimate is that, if current trends continue, by 2035/36, there will be nearly 48,000 more people living with diabetes than in 2021/2022, an increase of 22% to 260,000 people. This assumes that current conditions and assumptions continue unchanged. For example, we do not include the future impact of the scaled-up All-Wales Diabetes Prevention Programme in our models.
We have modelled three scenarios (Figure 10), all of which are estimates of the count of people of all ages with diabetes (Type 1 and Type 2) in Wales:
-
low count - assumes the 2021/22 diabetes prevalence rate of 6.5% remains constant until 2035/36. This is multiplied by the estimated population of people registered to GPs in Wales in 2035/36
-
medium count (central estimate) – counts are projected using an ARIMA model trained on the observed data, 2009/10 to 2021/22
-
high count – prevalence rates are projected using an ARIMA model trained on the observed data, and this is multiplied by the estimated population of people registered to GPs in Wales in 2035/36.
Without further action, it seems unlikely that the current prevalence rate will remain constant (low count model). The worst-case high-count model estimates an additional 67,000 more people living with diabetes in 2035/36 than in 2021/22, an increase of nearly one third (32%).
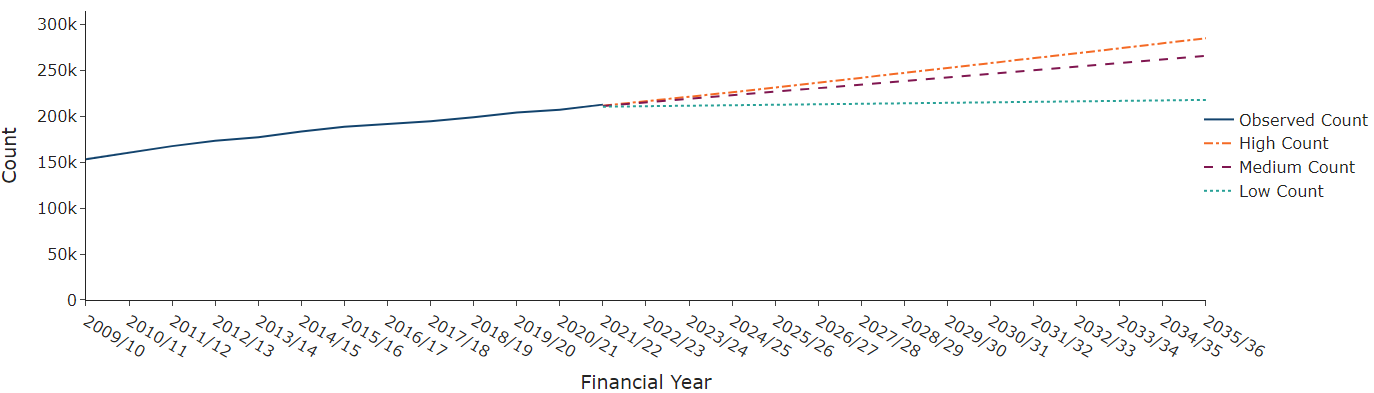
Figure 10: if current trends continue, our central projection estimates that an additional 40,000 people could be living with diabetes by 2035/36. Low projection: current prevalence rate remains constant, applied to GP population projections; central projection: time series forecast (ARIMA model) trained on the observed counts (QOF and QAIF, Welsh Government); high projection: time series forecast of rates of people with diabetes, applied to the GP population projections. See Section 5 for more details.
6. Risk factors for Type 2 diabetes
Risk factors for Type 2 diabetes are a mix of factors that can be changed (modifiable) and those that cannot (non-modifiable). Public health prevention is focussed on the modifiable risk factors.
Risk factors include:
-
Living with overweight and obesity
-
Not having a healthy diet
-
Family history of Type 2 diabetes
-
ASIAN, Black African, or African Caribbean origin
-
Taking certain medicines such as steroids for a long time
-
High blood pressure
-
Gestational diabetes during pregnancy.
Obesity
Adults reporting obesity (a body mass index, BMI, of 30 or more) are more than twice as likely to have diabetes (8.2%) as those who do not (3.6%, National Survey for Wales, 2022/23, Welsh Government).
More than one in four adults (16+ years) recorded living with obesity in 2021/22. This has grown steadily since 2003/4, although we cannot compare the results for 2003/4 and 2022/23 directly, due to changes in the methodology of the surveys used to collect the data. (Welsh Health Survey, National Survey for Wales, 2021/22, Welsh Government)
Figures 11 and 12 show that almost one in three people aged 45 to 64 years in Wales (31%) were living with obesity in 2021/22. Figure 13 shows that adults in the most deprived fifth of areas are about 50% more likely to be living with obesity than those in the least deprived fifth. (National Survey for Wales, 2021/22, Welsh Government).
Physical activity
As shown in Figure 14, over one third (35%) of females aged 45 to 65 years old and one third (33%) of males aged 45 to 65 years old reported that they were physically inactive in 2021/22. Adults in the most deprived fifth of areas in Wales are almost twice as likely to be physically inactive that in the least deprived fifth. Physical inactivity is defined as doing fewer than 30 minutes exercise in the previous week. (National Survey for Wales, 2021/22, Welsh Government)
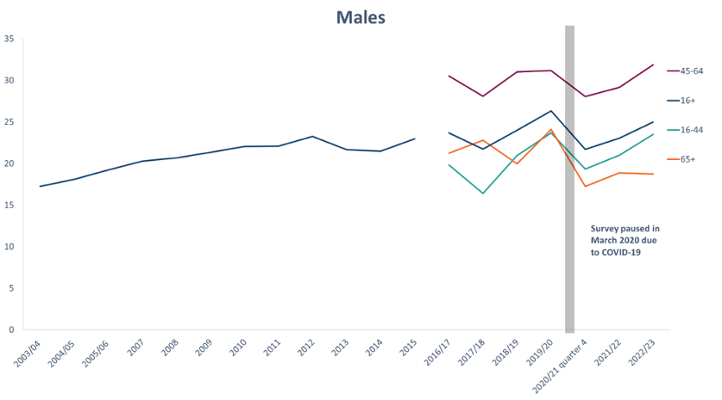
Figure 11: the number of males living with obesity in Wales has grown since 2003/4. Almost one in three adult males aged 45 to 64 years reported living with obesity (BMI 30+) in 2021/22. Welsh Health Survey, National Survey for Wales, 2021/22, Welsh Government
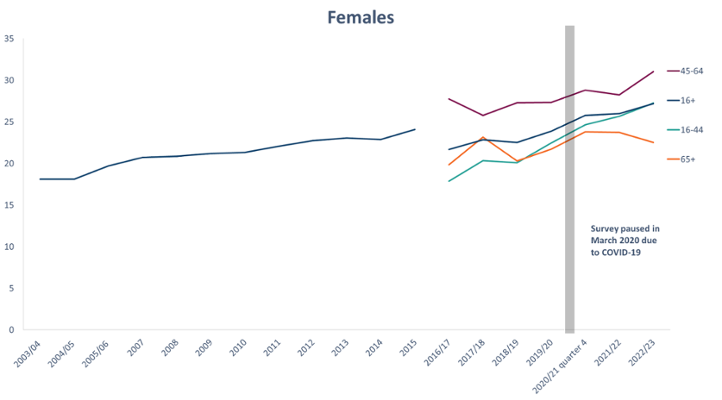
Figure 12: the number of females living with obesity (BMI 30+) in Wales has been growing steadily since 2003/4. Almost one in three females aged 45 to 64 years reported living with obesity in 2021/22. Welsh Health Survey, National Survey for Wales, 2021/22, Welsh Government
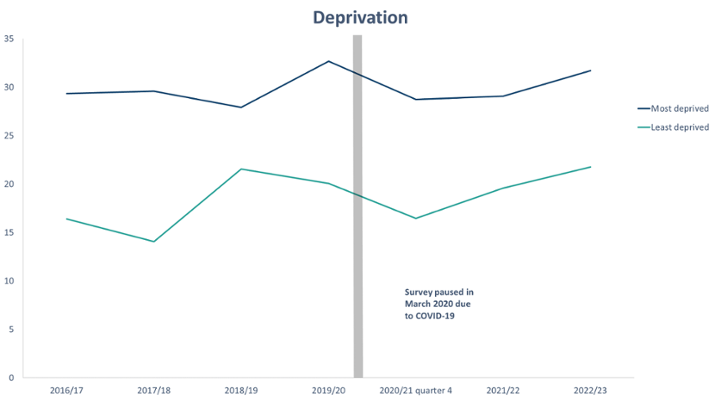
Figure 13: adults living in the most deprived fifth of areas in Wales are about 50% more likely to be living with obesity than those in the least deprived fifth. National Survey for Wales, 2021/22, Welsh Government
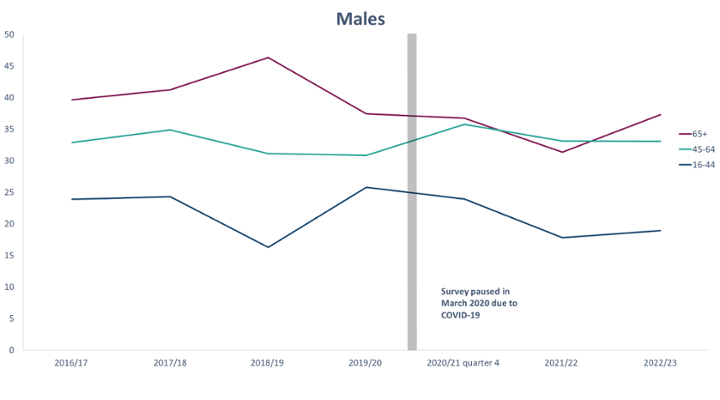
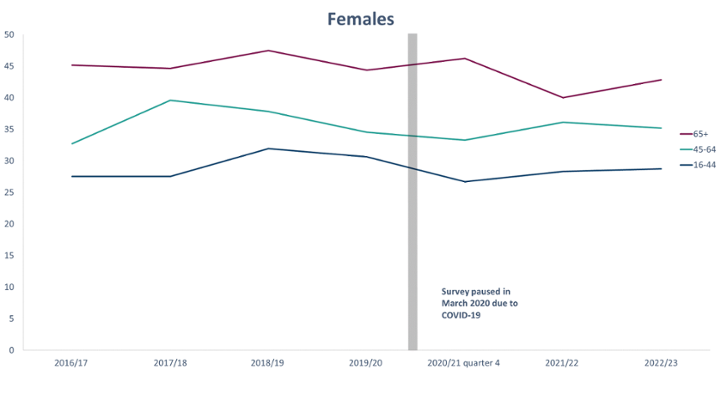
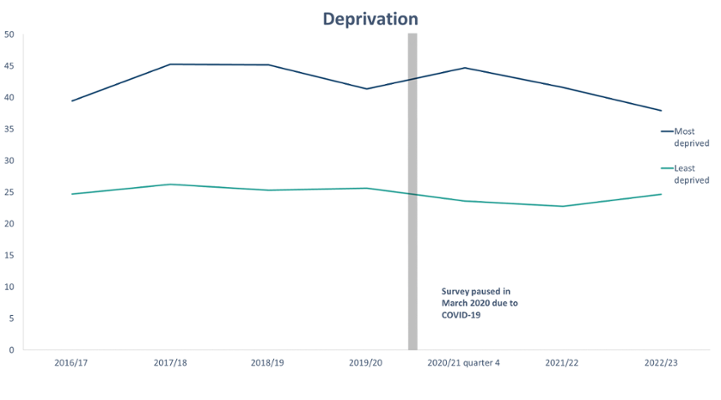
Figure 14: over one third (35%) of females aged 45 to 65 years old and one third (33%) of males aged 45 to 65 years old reported that they were physically inactive in 2021/22. Adults in the most deprived fifth of areas in Wales are almost twice as likely to be physically inactive that in the least deprived fifth. Physical inactivity is defined as doing fewer than 30 minutes exercise in the previous week. National Survey for Wales, 2021/22, Welsh Government
7. What actions is the public health system in Wales taking to deal with diabetes and its risk factors?
The current prevalence of diabetes in Wales is having an impact on people’s quality of life and puts pressure on the health system. The projections show that without change, more people’s lives will be affected, and the pressure on the system will increase.
Therefore, the ambition of the public health system is to build on its existing range of programmes to:
-
turn the corner and stop the increasing prevalence of diabetes
-
have more people living well with diabetes, measured through a reduction in amputations and other diabetes pathways.
This is not impossible. Over half of Type 2 diabetes cases could be prevented or delayed, through supporting people to make behavioural changes (How to prevent Type 2 Diabetes, Diabetes UK). Our approach will be, in addition to the existing programmes and pathways, to articulate a system-wide approach to achieve these ambitions, focussed on optimising blood glucose control.
For those who have already developed Type 2 diabetes, the Diabetes Remission Clinical Trial (DiRECT, Lean et al, 2019) showed that weight management can put Type 2 diabetes into remission. The trial found that, following the weight management programme, over one third of participants (36%) were in remission two years later, and two thirds of those who lost 10 kilograms or more were in remission after two years. The weight management programme also resulted in a reduced need for diabetes medications and a better quality of life compared with standard care.
Diabetes prevention pathway
The diabetes prevention pathway sets out the different areas where interventions could occur to prevent diabetes, shown in Figure 15. The role of Public Health Wales, as articulated in our Long-Term Strategy 2023 to 2035, is to inform, advocate, mobilise and deliver. Each of the areas of intervention will require a different mix of those four types of activity in order to achieve system-level outcomes.
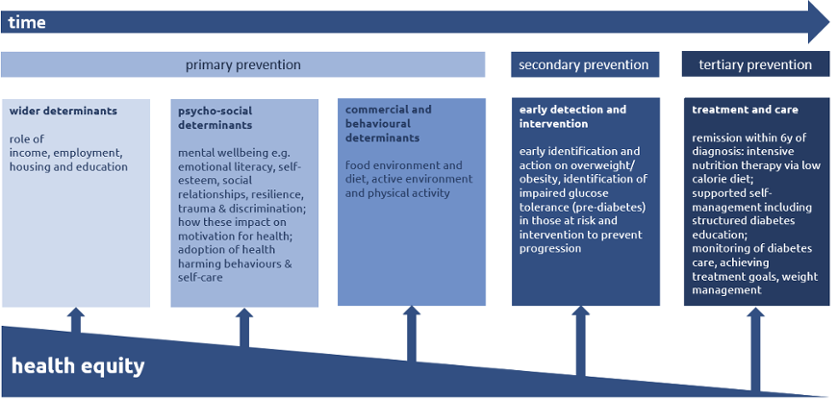
Figure 15: the diabetes prevention pathway, showing areas for primary, secondary and tertiary prevention
All-Wales Diabetes Prevention Programme
The All-Wales Diabetes Prevention Programme (AWDPP), funded by the Welsh Government and led by Public Health Wales, is targeted at people with an increased risk of Type 2 diabetes. In the programme, specially trained healthcare workers, supported by dietitians, offer a 30-minute consultation to people who have been identified as being at increased risk of developing diabetes through a blood test. The blood test is an HbA1c test, which measures a person’s average blood sugar (glucose) levels, over the last two to three months. In the consultation, the healthcare worker will talk to people about what they can do to reduce their risk of developing Type 2 diabetes. They may also refer them to additional sources of support. This consultation will be followed up with another appointment 12 months later.
The first phase of the AWDPP will be rolled out by March 2024. Two primary care clusters (groups of GPs, pharmacists, opticians, and dentists etc serving a local population) per Health Board are involved in the roll-out funded by the Welsh Government. Some Health Boards have also chosen to fund roll-out in additional clusters at the same time. The programme will be evaluated as the roll-out is implemented.
More information on the roll out can be found at on the All-Wales Diabetes Prevention Programme web pages.
Health Weight, Healthy Wales - All Wales weight management pathways
Healthy Weight: Healthy Wales is the Welsh Government’s delivery plan to prevent and reduce obesity.
As part of that strategy, Public Health Wales offers information on Healthy Weight, and has developed Healthy Weight Healthy You, a range of information and resources to help people achieve and maintain a healthy weight. The resources include Find Your Journey, a tool that tailors advice to your needs.
8. Useful links
-
Diabetes (PHW)
-
Diabetes NHS 11 Wales (external site)
-
Diabetes UK (external site)
-
Know Your Risk (external site): a tool to find out your level of risk of developing Type 2 diabetes
-
Let’s prevent diabetes (external site): a link for anyone who is at risk of developing type 2 diabetes and would like to know more
-
MyDESMOND (external site): diabetes self-management digital platform free to access for everyone in Wales who lives with Type 2 diabetes.
9. Data files
We are aware that there can be issues downloading the data files in Microsoft Edge. If you would like the data, you may need to use a different browser, use 'Save as' if the data opens in an online tab or contact us at Publichealthwalesobservatory@wales.nhs.uk
Download the data in this article – Excel
Download the data in this article - CSV