Cardiovascular disease prevalence – trends, risk factors, and 10-year projections
Author: Rhys Powell, Publichealthwalesobservatory@wales.nhs.uk
Many thanks for providing additional evidence and comments to: Clare Withey, Scott Wright, Llion Davies, Louisa Nolan, Nathan Lester, Rhian Hughes, Amrita Jesura, Rachel Lewis, Nicholas Gregory, Kevin Conway, Tracey Williams, Matt Kearney, Stephen Davies, Jaime Valentime, Sarah Davies, Zoe Wallace, Sarah Jones, Ilona Johnson, Julie Bishop
Date published: 17 April 2025
1. Purpose
This article focuses on cardiovascular disease. It includes:
- New projections of cardiovascular disease and clinical risk factors to 2033/34
- Discussion of the risk factors driving these projections
- The impact of cardiovascular disease on the NHS
- A summary of the activities of the health system to address cardiovascular disease prevalence and health outcomes.
This article is the fourth in our series looking at trends and projections for some of the most prevalent non-communicable diseases in Wales.
Cardiovascular disease covers several diseases affecting the heart or blood vessels and is a major cause of death and disability in Wales. This article covers the cardiovascular diseases and risk factors for which we have data. For some aspects of cardiovascular disease, data are not available for our analysis. The article also lists some of the services, programmes, prevention services and legislation that tackles cardiovascular disease in Wales.
We anticipate that this series of articles will be useful to planners and decision-makers, and indeed anyone who is interested in future projections of disease, and their underlying risk factors. It will also be useful to those interested in finding out about what we are doing to tackle cardiovascular disease.
All data from this article together with some additional breakdowns can be downloaded.
The articles in the series include:
- Diabetes prevalence – trends, risk factors, and 10-year projection (November 2023)
- A summary of prevalence of non-communicable disease and cancer incidence in Wales trends and 10-year projections (December 2024)
- A summary of trends in risk factors for non-communicable diseases (February 2025)
- Cardiovascular disease prevalence – trends, risk factors, and 10-year projections (this article)
- Respiratory disease prevalence – trends, risk factors, and 10-year projections (June 2025)
- Musculoskeletal disease (not yet available)
- Cancer (not yet available)
- Smoking scenarios (not yet available)
- Mental health (not yet available)
2. Headlines
- Cardiovascular disease is one of the largest causes of mortality in Wales, with ischaemic heart disease being the leading cause of mortality in 2022 (3,922 deaths) (Deaths registered in England and Wales, 2014 - 2023, Office for National Statistics).
- Avoidable mortality for diseases of the circulatory system has increased in recent years to 79.3 per 100,000 in 2021-23, following a sustained decreasing trend (Public Health Mortality and Mid-Year Estimates, Office for National Statistics).
- The number of patients on GP disease registers for cardiovascular diseases and cardiovascular risk factors, has increased over the last 13 years (Quality and Outcomes Framework, 2009/10 - 2018/19, Quality Assurance and Improvement Framework, 2019/20 – 2023/24, Welsh Government).
- The increase in prevalence counts will partially be attributable to an ageing population and to improved detection due to the financial incentives for accurate data as part of the Quality and Outcomes Framework.
- The move to the Quality Assurance and improvement Framework in 2019/20 removed these incentives, with the removal of these incentives potentially leading to poorer-quality reporting (Davies et al., 2025).
- Hypertension is one of the commonest clinical risk factors. The number of people on the hypertension register is projected to increase from 529,300 in 2023/24 to 565,900 people in 2033/34. These figures equate to a little over 1 in 6 people, an increase of 7%. This follows an increase of 11% between 2009/10 and 2023/24.
- Improved management of cardiovascular diseases, through prescriptions such as statins, has led to better health outcomes, including lower mortality and emergency admission rates. These improvements have slowed in recent years and are showing signs of reversal.
- This slowing may be attributable to a lack of improvement, and in some cases increases, in key risk factors, such as living with obesity, which in adults has increased by 44% in the last 20 years. (National Survey for Wales, 2016/17 - 2022/23, Welsh Government).
- A study on cardiovascular disease and socioeconomic disparities in 2018 by Bray et al. found that cardiovascular disease in England was a key driver of inequalities in health outcomes, with wide socioeconomic disparities most notably in stroke hospitalisation risk and case fatality and, to a lesser extent, in the quality of health care (Bray et al., 2018).
- In 2021, European age-standardised admission rates for heart and circulatory disease emergency admissions were around 57% higher for those in the most deprived areas than the least deprived areas (Patient Episode Database Wales, Digital Health and Care Wales).
3. Contents
1. Purpose
2. Headlines
3. Contents
4. Overview
5. Prevalence & projections
5.1 Historic prevalence
5.2 Projections
5.3 Demographics
6. Admissions
7. Mortality
8. Cost
9. Risk factors
9.1 Atrial Fibrillation
9.2 High Blood Pressure (Hypertension)
9.3 Cholesterol
9.4 Diabetes
9.5 Plus - (behavioural factors, wider determinants and non-modifiable factors such as ethnicity)
9.5.1 Healthy behaviours
9.5.2 Obesity
9.5.3 Smoking
9.5.4 Alcohol consumption
9.5.5 Deprivation
9.5.6 Non-modifiable risk factors
9.6 Air quality
9.7 Data availability
10. What Can Work
11. An overview of services, programmes, prevention services and legislation in Wales
11.1 Strategies and Legislation
11.2 Services supporting CVD risk factors
11.2.1 Health Checks
11.2.2 Optimising treatment of cardiovascular disease risk factors (ABCD)
11.3 Services supporting behavioural risk factors
12. Data quality and interpretation
12.1 COVID-19 pandemic
12.2 Prevalence data
12.3 Projection methods
12.4 Patient Episode Database Wales
12.5 Self-reported survey data
12.6 Welsh Health Survey
12.7 National Survey for Wales
12.8 Child Measurement Programme for Wales
12.9 Air quality
12.10 Prescriptions
13. Download the data
13.1 Download the data in this article – Excel
13.2 Download the data from this article with additional breakdowns - CSV
13.3 Download the data from this article with additional breakdowns - CSV
4. Overview
Both cardiovascular diseases and cardiovascular disease risk factors have increased in prevalence counts over time. Part of this will be due to Wales’ ageing population as well as improved detection. Modifiable risk factors, such as poor diet and physical inactivity, have shown little signs of improvement in recent years which may also be contributing to the increased prevalence count.
Improved management of cardiovascular diseases has led to better health outcomes, such as lower mortality and emergency admission rates. Despite this, cardiovascular disease remains one of the largest causes of mortality in Wales. From 2002-04, avoidable mortality due to diseases of the circulatory system had been decreasing. However, it has been gradually increasing since 2018-20. Improvements to the treatment and management of cardiovascular disease led to falling mortality rates but increases in the prevalence count of risk factors such as living with obesity may be reversing those improvements to the mortality rate.
There is a significant and persistent gap in the cardiovascular disease mortality rates and admission rates between people living in the most and least deprived areas in Wales. This is also reflected in the prevalence count of cardiovascular disease risk factors, such as hypertension and living with obesity. The only exception to this is alcohol consumption. But, although individuals living in the most deprived areas may consume less alcohol, they tend to suffer worse alcohol related health outcomes (Lewer et al., 2016).
There are gaps in relevant data collection, for example lipid levels and blood pressure optimisation. This makes it harder to monitor emerging trends, measure the impact of interventions and management of cardiovascular disease on a large scale.
While there has been improvement in the detection and management of cardiovascular disease, prevention is still the ultimate goal. The Chief Medical Officer advocates for both primary prevention interventions, for example Healthy Weight, Healthy Wales, and secondary prevention interventions, for example the Stop a Stroke campaign, as important and mutually supportive in tackling cardiovascular disease.
5. Prevalence & projections
5.1 Historic prevalence
Our analysis primarily focuses on counts. We chose counts, as they are the most consistent data measure available to us over a long enough period to allow projections. An increase in prevalence counts does not necessarily mean an increase in prevalence rates as the total population may also increase.
Prevalence is a measure that looks at how many known cases of a disease are in the population at any given point. As shown in our prevalence and projections article, prevalence counts of cardiovascular disease has been increasing over the last 13 years (Table 1). An increase is expected due to Wales’ ageing population and improved detection, however other risk factors, such as living with obesity, may have contributed as well. This is particularly true of atrial fibrillation, where increased multimorbidity is also a factor.
Number of patients on cardiovascular disease related registers, change from 2009/10 to 2023/24
| Measure | Condition | Count in 2009/10 | Count in 2023/24 | Percentage increase |
|---|---|---|---|---|
| Cardiovascular disease | Heart failure | 28,500 | 42,500 | 49% |
| Cardiovascular disease | Stroke/Transient Ischaemic attack (TIA) | 64,100 | 72,400 | 13% |
| Clinical risk factor | Hypertension | 478,000 | 529,300 | 11% |
| Clinical risk factor | Atrial fibrillation | 53,400 | 84,900 | 59% |
Table 1: The number of patients on cardiovascular disease registers has increased over time, with the number on the heart failure register nearly doubling. An increase is expected due to Wales’ ageing population and improved detection, although other factors, such as living with obesity, will also contribute. Percentages have been rounded to the nearest whole number and counts to the nearest hundred. (Quality and Outcomes Framework, 2009/10 to 2018/19, and the Quality Assurance and Improvement Framework, 2019/20 to 2023/24, Welsh Government).
Table 2 shows the prevalence rate of cardiovascular disease and clinical risk factors. These have been either stable or gradually increasing since 2019/20. Atrial fibrillation, heart failure and hypertension are all more prevalent in 2023/24 than they were in 2019/20. Stroke and Transient Ischaemic Attack (TIA, or ‘mini’ stroke) prevalence rate has remained the same (Quality Assurance and Improvement Framework, 2019/20 to 2023/24, Welsh Government).
Cardiovascular disease registers prevalence rate, 2019/20 to 2023/24
| Measure | Condition | Prevalence in 2019/20 | Prevalence in 2023/24 |
|---|---|---|---|
| Cardiovascular disease | Heart failure | 1.1 | 1.3 |
| Cardiovascular disease | Stroke/Transient Ischaemic attack (TIA) | 2.2 | 2.2 |
| Clinical risk factor | Hypertension | 15.9 | 16.0 |
| Clinical risk factor | Atrial fibrillation | 2.4 | 2.6 |
Table 2: The prevalence rate (as a percentage) has either remained stable or slightly increased in recent years. (Quality and Outcomes Framework, 2009/10 to 2018/19, and the Quality Assurance and Improvement Framework, 2019/20 to 2023/24, Welsh Government).
It must be noted that patients on the hypertension clinical risk register may have their hypertension managed to safe levels through treatment. In this case, they will remain on the register and receive an annual review, but the treatment will have reduced their risk of cardiovascular disease.
Although only prevalence rates represent the true prevalence since they take in to account the population size, counts are still useful. Counts will show us the impact on the system, whereas a prevalence rate will show us if the situation is getting proportionally worse. Stroke and TIAs are a good example of this. Since 2019/20 the prevalence rate has remained the same, 2.2%. In that same period, the count of people on the register has increased by 2,000. Counts are available from 2009/10 via the Quality and Outcomes Framework and to 2019/20 via the Quality and Improvement Framework. Prevalence rates are only available from 2019/20 via the Quality and Improvement Framework. Some age-standardised analysis is available in our Primary Care Clusters dashboard.
Primary care registers should be interpreted with caution, as some increases may not be due to an actual change in prevalence rate. As medicine progresses, methods may be developed to improve detection, leading to better identification as opposed to an actual increase.
Conversely, when the Quality Assurance and Improvement Framework replaced the Quality and Outcomes Framework in 2019/20, the change in contract for data collection from primary care has potentially led to changes in data quality. Specifically, under counting data due to poorer-quality coding (Davies et al., 2025). This is particularly true when the changes are small, as it is not possible to say with absolute certainty if it represents a true change or is due to a change in data collection. There is also likely to be an undercount of the true number of people living with cardiovascular disease or cardiovascular risk factors, as not everyone may have been diagnosed.
5.2 Projections
We have projected the register data forward 10 years, from our latest data point (April 2024), to estimate the counts in 2033/34. We do not expect these projections to be precise, rather, they show a likely direction of travel should nothing change in between. For example, the introduction of a health, policy or legislative intervention aimed at reducing unhealthy behaviours, such as the introduction of smoking bans, might be expected to lower the estimated counts. More information on the method is available in section 12, or you can contact us via Publichealthwalesobservatory@wales.nhs.uk
Projected change of the number of patients on select cardiovascular disease registers 2023/24 to 2033/34
| Measure | Condition | Projected count in 2033/34 | Percentage increase |
|---|---|---|---|
| Cardiovascular disease | Heart failure | 61,800 | 46% |
| Cardiovascular disease | Stroke/Transient Ischaemic attack (TIA) | 78,400 | 8% |
| Clinical risk factor | Hypertension | 565,900 | 7% |
| Clinical risk factor | Atrial fibrillation | 106,900 | 26% |
Table 3: A table showing cardiovascular disease registers and the projected count change, and the percentage change this represents. All register counts are projected to increase between the last observed data, 2023/24, and 2033/34. Percentages have been rounded to the nearest whole number and counts to the nearest hundred. (Quality and Outcomes Framework, 2009/10 to 2018/19, and the Quality Assurance and Improvement Framework, 2019/20 to 2023/24, Welsh Government).
As shown in Table 3, if current trends continue, and no additional action is taken to try to reduce the prevalence count of these diseases and risk factors, they will continue to increase over the next 10 years.
The most populous of all registers captured by the Quality Assurance and Improvement Framework is hypertension, a clinical risk factor. Hypertension (high blood pressure) is a significant cardiovascular risk factor associated with increased ischaemic heart disease, cerebrovascular accidents and heart failure. The prevalence rate of hypertension has increased since 2019/20, albeit gradually, to 16% in 2023/24. Our projections show this will continue to increase to roughly 565,900 people 2033/34 (Figure 1). There has been an increase of just over 51,200 people over 15 years since 2009/10 (Table 1) and a small increase in the prevalence rate between 2019/20 and 2023/24 (Table 2). This increase will partly be due to the ageing population. However, the continuing increases of prevalence for risk factors like obesity will likely have also played a part.
Observed (2009/10 to 2023/24) and projected (2024/25 to 2033/34) hypertension register patients, count
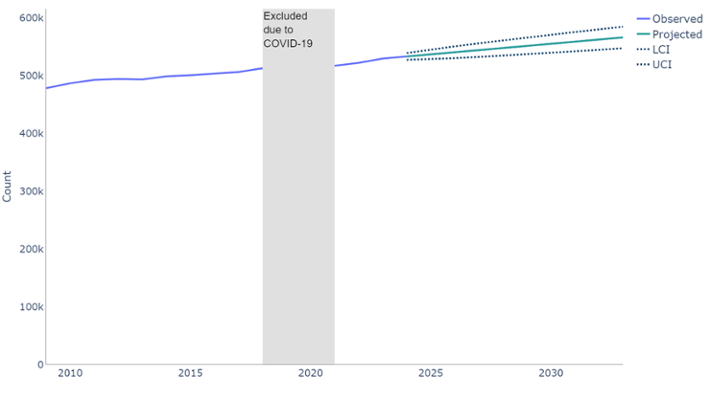
Figure 1: If current trends continue, although gradual, the number of people registered with hypertension will continue to increase. Time series forecast (ARIMA model) trained on the observed counts. (Quality and Outcomes Framework, 2009/10 to 2018/19, and the Quality Assurance and Improvement Framework, 2019/20 to 2023/24, Welsh Government).
5.3 Demographics
Generally, cardiovascular diseases and clinical risk factors are more prevalent in older people (aged 70+), but hypertension is also seen at younger ages (Figure 2). Prevalence of cardiovascular diseases and clinical risk factors is higher in the male population, except for hypertension. (Quality Assurance and Improvement Framework, 2023/24, Welsh Government).
As Wales has an ageing population, there will be an increase in prevalence count as the population reaches the ages most affected by hypertension. The falling birth-rate means there will likely be less people developing conditions due to age in the future. If everything else remained the same in respect of risk factors or improvement measures, we would eventually start to see a reduction in numbers, but not necessarily the prevalence rate.
Population pyramid for cardiovascular disease and risk factor register patients 2023/24, percentage
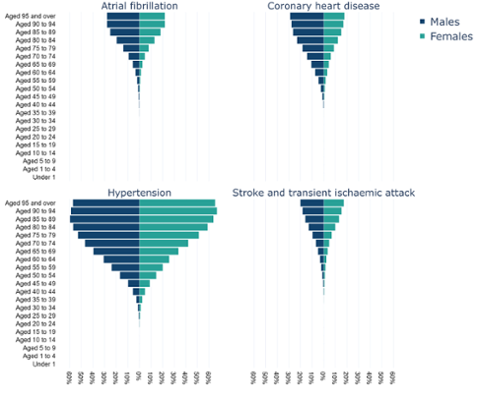
Figure 2: Cardiovascular disease and risk factor registers have higher prevalence in older people, with hypertension being more prevalent in females and atrial fibrillation, coronary heart disease and stroke/TIA males. (Quality Assurance and Improvement Framework, Welsh Government).
6. Admissions
Age-standardised emergency admission rates for cardiovascular disease as a whole are lower in 2022/23 (943 per 100,000) than 2011/12 (1,144 per 100,000). (Patient Episode Database Wales, Digital Health and Care Wales). One common feature across all breakdowns is the increase from 2021/22. Following a general decrease since the early 2000’s, admissions saw a sharp decline due to COVID-19 and the effect it had on medical services. Since then, rates have increased and are close to pre-COVID-19 emergency admission rates, although still lower than the early 2000’s.
Regardless of whether we consider cardiovascular disease as a whole, or specific conditions, there remains a gap between rates in the most and least deprived fifths of Wales. Age-standardised rates are consistently higher in the most deprived fifth of areas in Wales (Figure 3), although the gap has narrowed for ischaemic heart disease, decreasing from a difference of 204 per 100,000 in 2011/12 to 80 per 100,000 in 2022/23, a reduction of 60%. This has largely been due to greater decreases most years in the most deprived fifth, and a particularly large decrease in 2013/14. (Patient Episode Database Wales, Digital Health and Care Wales).
As described above, the most deprived areas report higher prevalence of cardiovascular disease. Inequalities in health are not caused by one single issue, but a complex mix of environmental and social factors, which impact on a person’s health behaviours, and health outcomes. When considering cardiovascular disease, this complex mix of factors will not only increase a person’s risk of developing cardiovascular disease, but it will also impact on their likelihood to engage and comply with cardiovascular disease treatment plans. Analysis by The Kings Fund illustrates this relationship between poverty and NHS services (The Kings Fund, 2024 ).
Due to the ageing population of Wales, although age-standardised measures may continue to fall, absolute numbers and crude rates (and, therefore, impact on services) may continue to increase.
Emergency admissions for cardiovascular disease (I00-I99) by deprivation fifth, European age-standardised rate (EASR) per 100,000
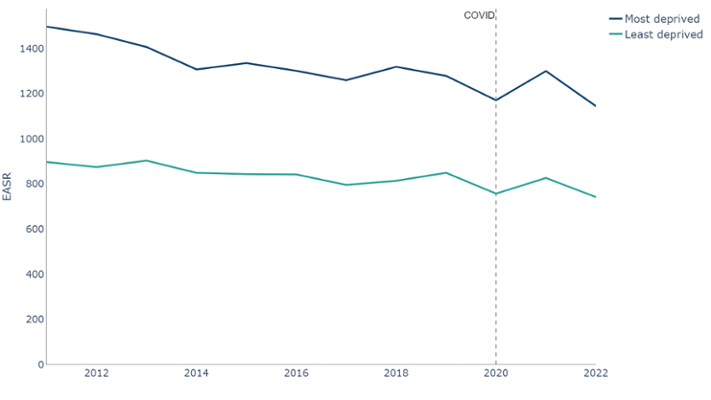
Figure 3: The European age-standardised rate of emergency admissions for cardiovascular disease has generally decreased over time. Although narrowing for some conditions, there is still a gap between most and least deprived fifths, (Patient Episode Database Wales, Digital Health and Care Wales).
As shown in the prevalence demographics, cardiovascular disease is most prevalent in older people. When split by age we can see that the under 75 age group made up around 69% of emergency cardiovascular disease admissions in 2022/23, with an age standardised rate of 572 per 100,000 (Figure 4).
Emergency admissions for cardiovascular disease (I00-I99) by age, age-specific rate per 100,000
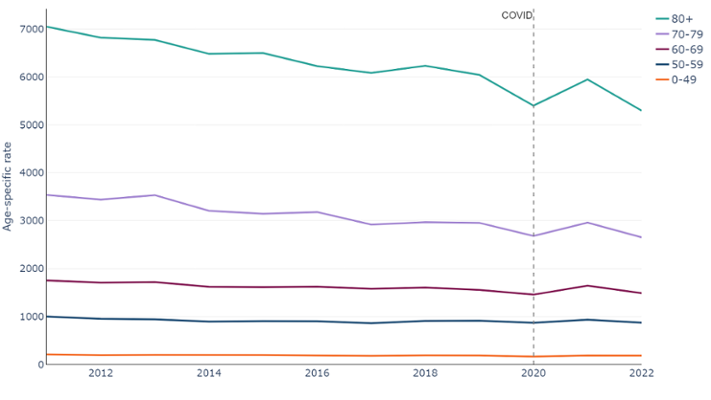
Figure 4: Emergency admissions for cardiovascular disease have generally decreased over time, however. (Patient Episode Database Wales, Digital Health and Care Wales).
The completeness of diagnostic coding for hospital admissions has decreased in recent years. Due to this we are not showing breakdowns where more than 10% of admitting episodes were missing a primary diagnosis. At a national level, we have excluded Wales by deprivation fifth breakdowns for 2023 only. Please refer to section 12 for details on any excluded breakdowns from the wider dataset.
7. Mortality
Over the last 10 years, ischaemic heart diseases (covering the ICD-10 codes I20-I25) and cerebrovascular diseases (covering the ICD-10 codes I60-I69) are consistently two of the leading underlying causes of death in Wales. In 2023, ischaemic heart disease was the underlying cause for 3,739 deaths, and cerebrovascular diseases 1,804. Combined, these two cardiovascular disease groupings accounted for 15% of all deaths in Wales (Deaths registered in England and Wales, 2014 - 2023, ONS). These figures are based on the underlying cause of death, that is the disease or injury, which initiated the train of events leading directly to death.
The age-standardised death rate from cardiovascular disease decreased rapidly from the early 2000’s, with a far more gradual decrease from 2012 to 2019. Since 2019, it has increased slightly. There continues to be a gap between those living in the most and least deprived areas, with those in the most deprived areas consistently having a higher rate of deaths, with 350 per 100,000 in the most deprived fifth compared to 197 per 100,000 in the least deprived fifth.(Figure 5).
Deaths from cardiovascular disease (I00-I99) by deprivation fifth, European age-standardised rate per 100,000
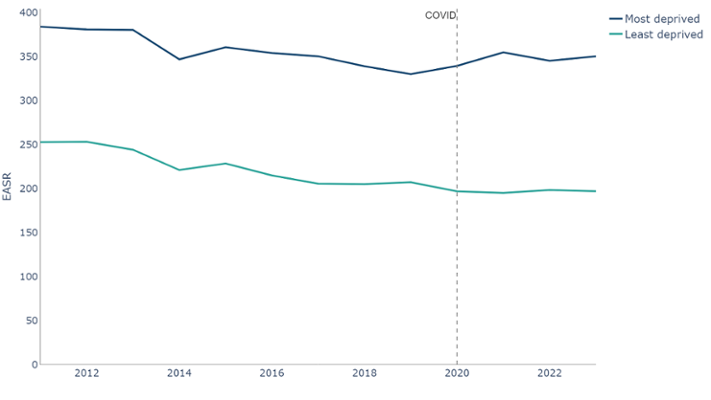
Figure 5: Deaths with any mention of cardiovascular disease, European age-standardised rates (EASR) per 100,000. Dark blue line: Least deprived fifth. Light blue line: Most deprived fifth. There is a clear and consistent gap in deaths between the most and least deprived fifth, with more occurring in the most deprived fifth. (Public Health Mortality, Mid-Year Population Estimates, Office for National Statistics).
Most deaths with an underlying cause of cardiovascular disease occur in the older age groups. In 2023, there were 92 per 100,000 deaths in the under 75-age group. In terms of count, this was 2,854 deaths out of 8,919, 32% of all deaths. (Figure 6).
Deaths from cardiovascular disease (I00-I99) by age, European age-standardised rate per 100,000
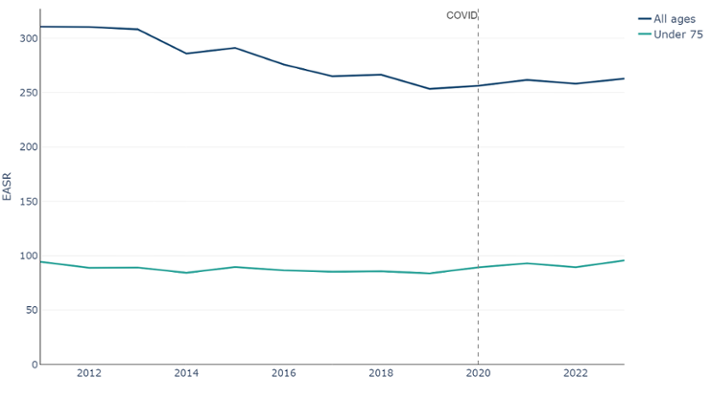
Figure 6: Mortality had been decreasing, although the decrease has slowed. Since COVID-19, mortality has risen slightly. As this rate is age-standardised, the effects due to the aging population, or population increases have been removed. (Public Health Mortality, Mid-Year Population Estimates, Office for National Statistics).
Age-standardised rates of avoidable mortality (Figure 7) for diseases of the circulatory system had been decreasing prior to COVID-19 but has seen an increase in recent years to 79 per 100,000 in 2021-23. In terms of the actual count, the number of avoidable deaths had been decreasing to a low of 6,445 in 2012-14. Since then it has gradually been increasing to 7,133 in 2021-23. It is clear that the improvements up to 2011 have stalled.
Avoidable mortality for diseases of the circulatory system, European age-standardised rate per 100,000
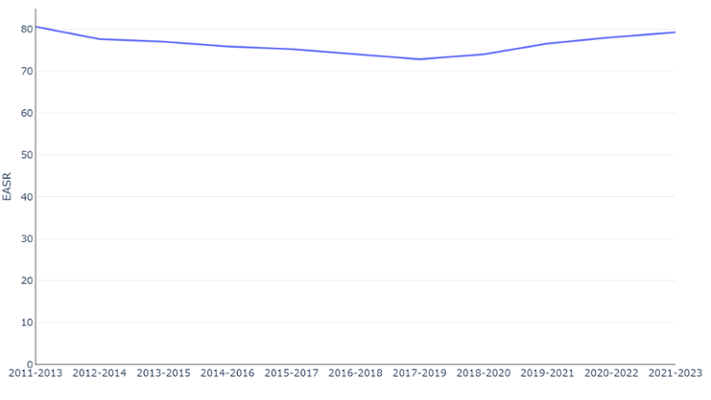
Figure 7: Avoidable mortality of the circulatory system deaths were falling but have risen in recent years. As this rate is age-standardised, the effects due to the aging population, or population increases have been removed (Public Health Mortality, Mid-Year Population Estimates, Office for National Statistics).
While improvement in the treatment and management of cardiovascular disease will have contributed to the falling mortality rates, increases in the prevalence of risk factors such as living with obesity may be reversing these improvements. Due to the ageing and increasing population of Wales, even where age-standardised measures may continue to fall, absolute numbers and crude rates may continue to increase.
8. Cost
A study by Collins et al in 2022 showed that the total 10-year cumulative incremental net monetary cost associated with a persistent plateauing of cardiovascular disease for England and Wales came to £54 billion. This figure includes healthcare costs, social care costs, informal care and value of lost quality adjusted life years (Collins et al., 2022 ).
A British Heart Foundation factsheet released in January 2025 estimated the total NHS Wales expenditure on heart and cardiovascular disease at an estimated £770 million. It also estimates that the overall cost to the Welsh economy (including premature death, long-term care, disability and informal costs) is an estimated £1.6 billion each year (British Heart Foundation, 2025).
Since 2009/10, the amount of money spent on circulation problems by NHS Wales has increased from £459 million to £706 million in 2022/23, an increase of 54 %.(NHS Expenditure programme budgets, Welsh Government). Of that £706 million:
- £118 million was spent on coronary heart disease;
- £133 million was spent on cerebrovascular disease;
- £455 million was spent on other problems of circulation, which may include expenditure linked to the above sub-categories but could not be allocated directly to them;
- £564 million is spent in secondary care settings, i.e. hospitals. This equates to around 80% of the total.
The net ingredient cost of dispensed prescriptions (Figure 8) reached a peak of £151 million in 2004/05, before decreasing to a low of £63 million in 2014/15. Since then it has gradually been increasing to £103 million in 2023/24. Over this period, the number of items dispensed has been increasing, nearly doubling between 2001/02 and 2023/24 where around 23.5 million prescriptions were dispensed. (Prescription items and cost by area and BNF chapter, Prescribing Services, NHS Wales Shared Services Partnership)
Number of dispensed cardiovascular system prescriptions and net ingredient cost between 2001/02 and 2023/24
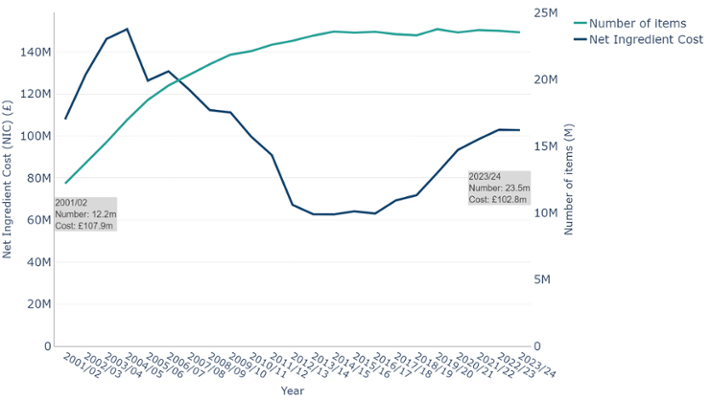
Figure 8: The number of items prescribed to treat and manage cardiovascular has remained relatively stable since 2014/15, at around 23.5 million. However, in that time the net cost of prescribing has increased by 64%. (Prescribing Services, NHS Wales Shared Services Partnership).
9. Risk factors
Risk factors for cardiovascular disease can be categorised as those that can be changed (modifiable) and those that cannot (non-modifiable), as well as behavioural risk factors, which are covered in more detail in our risk factors article, and clinical risk factors. A clinical risk factor is a risk factor that requires some form of clinical assessment and measurement. For example, hypertension is a clinical risk factor as it requires a GP to measure an individual’s blood pressure to diagnose them as having hypertension.
Risk factors for cardiovascular disease can be defined using ABCD Plus:
Atrial fibrillation
Blood pressure
Cholesterol
Diabetes
Plus (behavioural factors, wider determinants and non-modifiable factors such as ethnicity etc.)
This section will look at some of these key risk factors for cardiovascular disease where data are readily available.
9.1 Atrial Fibrillation
Atrial fibrillation is a cardiovascular disease and a clinical risk factor. It is the most common form of abnormal heart rhythm (arrhythmia) and a major cause of stroke. Atrial fibrillation is a contributing factor to one in five strokes in Wales, and people with atrial fibrillation are five times more likely to have a stroke than people without the condition.
In 2009/10 (Table 1) there were approximately 53,400 people diagnosed with atrial fibrillation in Wales, this has increased to 84,900 in 2023/24. Our projections show this could increase to 106,900 in 2033/34 (Table 3). Atrial fibrillation is often asymptomatic (Rho et al., 2005), frequently undetected and undiagnosed, meaning there are likely to be thousands more affected by the condition across Wales (British Heart Foundation, 2025).
9.2 High Blood Pressure (Hypertension)
High blood pressure, also known as hypertension, is a clinical risk factor and the leading modifiable risk for heart and circulatory diseases in Wales. Around half of heart attacks and strokes in Wales are associated with high blood pressure. Whilst almost 530,000 people in Wales are captured on their GP’s hypertension register (Table 1), it is estimated that as many as 220,000 people could be undiagnosed (British Heart Foundation, 2025).
9.3 Cholesterol
Raised cholesterol, or lipids, increases the risk of heart disease and stroke and is a major cause of disease burden. The British Heart Foundation factsheet on cardiovascular disease in Wales highlights lipids as a key risk factor (British Heart Foundation, 2025). It is estimated that 1 in 5 deaths from heart and circulatory diseases in Wales are associated with high (low-density lipoprotein) lipids. One way of managing lipid related risks and illness, including cardiovascular disease prevention, is through lipid modification treatments.
Lipids data are not routinely available in Wales, therefore, we are unable to monitor trends in lipid levels over time.
9.4 Diabetes
Diabetes is a disease in its own right, however, is considered in the risk factor section for pragmatic reasons. A close link exists between diabetes and cardiovascular disease, which is the most common cause of disability and death in a patient with diabetes. Cardiovascular disease risk factors such as living with obesity, high blood pressure and high cholesterol are often common in patients with type 2 diabetes. This places them at increased risk for heart failure and strokes. In addition, many studies found biological mechanisms associated with diabetes that independently increase the risk of cardiovascular disease in patients with diabetes (Leon et al., 2015).
As covered in our prevalence and projections article, since 2009/10 the number of adults aged 17 years or older living with diabetes has increased by 45% to 222,700 in 2023/24 (Quality Outcomes Framework, 2018/19 and Quality Assurance and Improvement Framework, 2021/22, Welsh Government).
If current trends continue, by 2033/34, we estimate that around 272,300 adults aged 17+ will be living with diabetes, an increase of around 22%. More information on diabetes can be found in our diabetes article.
9.5 Plus - (behavioural factors, wider determinants and non-modifiable factors such as ethnicity)
The ‘Plus’ covers a wide variety of risk factors, many of which have been covered in more detail in our risk factor article. A number of these are related to unhealthy behaviours, such as living with obesity, or may lead to the development of clinical risk factors.
9.5.1 Healthy behaviours
Overall, unhealthy behaviours like physical inactivity, high alcohol consumption and low fruit and vegetable consumption have not shown much improvement since 2020/21 (Table 4), our earliest comparative data point. Improvements to smoking prevalence have slowed in recent years.
Percentage of adults aged 16+ in Wales reporting health behaviours
| Health behaviour | 2020/21 quarter 4 January-March 2021 | 2022/23 |
|---|---|---|
| Living with obesity | 24 | 26 |
| Ate no fruit and vegetable portions the previous day | 6 | 7 |
| Ate at least 5 fruit and vegetable portions the previous day | 31 | 29 |
| Physically active less than 30 minutes in the previous week | 32 | 31 |
| Physically active at least 150 minutes in the previous week | 51 | 55 |
| Average weekly alcohol consumption none | 20 | 17 |
| Average weekly alcohol consumption above guidelines | 17 | 17 |
| Current smoker | 14 | 13 |
Table 4: Healthy behaviours have shown little improvement in recent years, with physical activity and smoking being the only ones seeing an improvement. However, it should be noted that none of the changes are statistically significant. Survey paused in March 2020 due to COVID-19. (National Survey for Wales, observed percentage, Welsh Government).
9.5.2 Obesity
Living with obesity can lead to a lower general health and increase the risk of developing clinical risk factors such as hypertension. In Wales, around 1 in 9 heart and circulatory diseases are associated with a high body-mass index (British Heart Foundation, 2025).
Whilst acquired cardiovascular disease does not typically present in children, studies have also shown that children and adolescents living with obesity are five times more likely to be living with obesity in adulthood (Simmonds et al., 2016).
Obesity in children has been relatively stable, fluctuating at around 11 to 12%. The latest Child Measurement Programme (2022/23 academic year) recorded 11.4% of children aged 4-5 as having obesity. (Child Measurement Programme, Public Health Wales)
Whilst there is an element of personal choice with diet, it is important to consider the obesogenic environment (Government Office for Science, 2007). This refers to the role environmental factors may play in determining both nutrition and physical activity.
9.5.3 Smoking
Smoking is a major risk factor for cardiovascular disease, with harmful substances in tobacco causing damage to and narrowing blood vessels.
The proportion of people smoking in Wales has been decreasing over time, halving from 26% in 2003/04 to 13% 2022/23 (Welsh Health Survey (2003/04), National Survey for Wales (2022/23), Welsh Government). However, despite these improvements, the Welsh Government target of less than 5% by 2030 is not projected to be met.
9.5.4 Alcohol consumption
Regularly consuming alcohol, particularly at higher levels, is linked to developing hypertension (British Heart Foundation, 2025).
Since 2016/17, the percentage of adults consuming more than 14 units a week, which is over the guidelines, has fluctuated at just under 20%. In 2022/23, the figure was at 17%. (National Survey for Wales, 2022/23, Welsh Government).
9.5.5 Deprivation
Studies have shown that people from deprived areas of Wales are more likely to suffer higher rates of cardiovascular disease mortality and morbidity. This is not caused by one single issue, but a complex mix of environmental and social factors, which affect a person’s health behaviours, and health outcomes. When considering cardiovascular disease, this complex mix of factors will not only increase a person’s risk of developing cardiovascular disease, but could also affect their ability to engage and comply with cardiovascular disease treatment plans in a timely manner.
There is a significant and persistent gap in the cardiovascular disease mortality rates and admission rates between people living in the most and least deprived areas in Wales. This is also reflected in the prevalence of those living with obesity (Figure 9) and of the cardiovascular disease behavioural risk factors (Figure 10). The only exception to this is alcohol consumption. Although individuals living in the most deprived areas may consume less alcohol, they tend to suffer worse health outcomes (Lewer et al., 2016).
Adults living in the most deprived fifth of areas in Wales are about 50% more likely to have obesity than those in the least deprived fifth, with roughly 1 in 3 people having obesity (National Survey for Wales, 2022/23, Welsh Government).
Percentage of adults aged 16+ who self-report as living with obesity in the most and least deprived fifths of areas in Wales
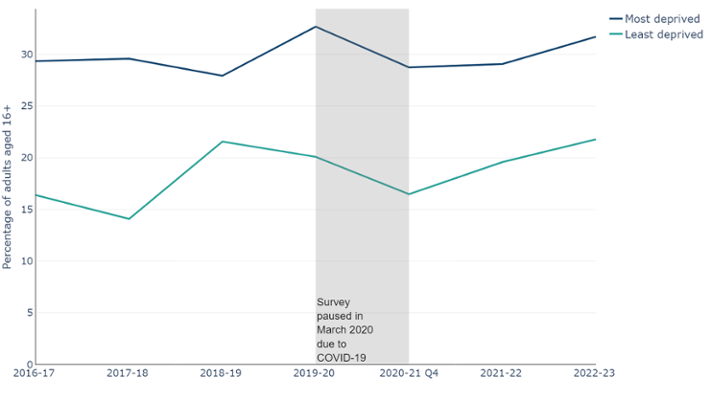
Figure 9: Adults living in the most deprived fifth of areas in Wales are about 50% more likely to be living with obesity than those in the least deprived fifth, with roughly 1 in 3 people living with obesity (National Survey for Wales, 2016/17 - 22/23, Welsh Government).
Hazardous levels of alcohol consumption are defined as consuming between 14 to 50 units per week for males and 14 to 35 units per week for females. Individuals in higher socioeconomic status groups are more likely to report exceeding recommended drinking limits, but those in lower socioeconomic status groups experience more alcohol-related harm. This has been called the ‘alcohol harm paradox' (Lewer et al., 2016)
Percentage of adults living in the most and least deprived fifth of areas in Wales reporting unhealthy behaviours
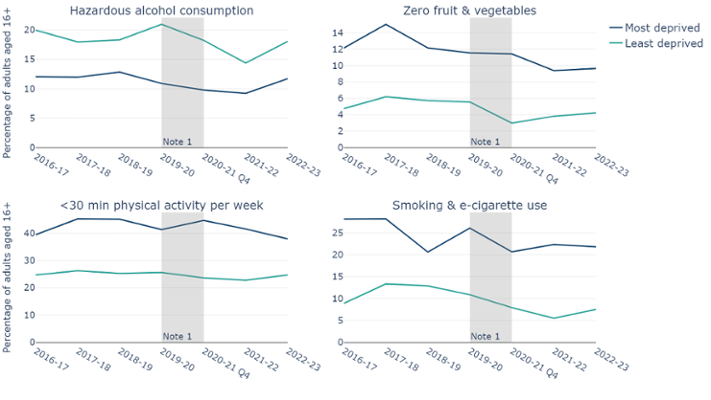
Figure 10: Higher levels of unhealthy behaviours are reported in the most deprived areas compared to the least deprived areas, except for alcohol consumption. Top left chart shows alcohol consumption at hazardous levels, top right chart shows adults consuming zero fruit and vegetables in the previous day, bottom left chart shows adults being physically active for fewer than 30 minutes in the previous week and bottom right shows adults reporting to smoke or use e-cigarettes. Note 1: Survey paused in March 2020 due to COVID-19. (National Survey for Wales, observed percentage, 2016/17 - 2022/23, Welsh Government).
Beyond the unhealthy behaviour factors that contribute towards an increased prevalence of cardiovascular disease, people from the most deprived areas often seek medical advice at later stages, which can lead to poorer health outcomes. Analysis by The Kings Fund looked at the relationship between poverty and the NHS. In 2022, a survey of showed that 56% of NHS providers reported an increase in people delaying seeking help due to the cost of living (The Kings Fund, 2025 ).
The analysis also cited access difficulties. These can be practical issues, such as the ability to travel to medical appointments. There are also barriers such as health literacy. This refers to the personal characteristics and social resources needed for individuals and communities to access, understand, appraise and use information and services to make decisions about health. Health literacy includes the capacity to communicate, assert and enact these decisions. However, the onus is not solely on the patient, service providers must also ensure that literature, advice and services are provided and communicated in a way that is understandable to the audience.
These are examples of the ‘Inverse Care law’, as defined by the GP Julian Tudor Hart. (Hart, 1971). It describes how the people who most need health are least likely to receive it. A report looking at ways to tackle the inverse care law found that GP practices in the most deprived areas of England are relatively underfunded, under-doctored, and perform less well on a range of quality indicators compared with practices in wealthier areas (Fisher et al., 2022 ).
9.5.6 Non-modifiable risk factors
There are also non-modifiable risk factors, such as genetics, age, sex and ethnicity. These factors can affect your likelihood of developing a cardiovascular disease, as well as placing you at a higher risk of mortality and morbidity from cardiovascular disease. Of all the non-modifiable risk factors, and risk factors in general, increasing age is arguably the most important with regard to future count projections of cardiovascular disease. As Wales has an ageing population (Figure 11), there will be an increase as the population reaches the ages most affected by cardiovascular disease.
Population pyramid by age and sex, percentage, Wales, 2021 and 2035, percentage
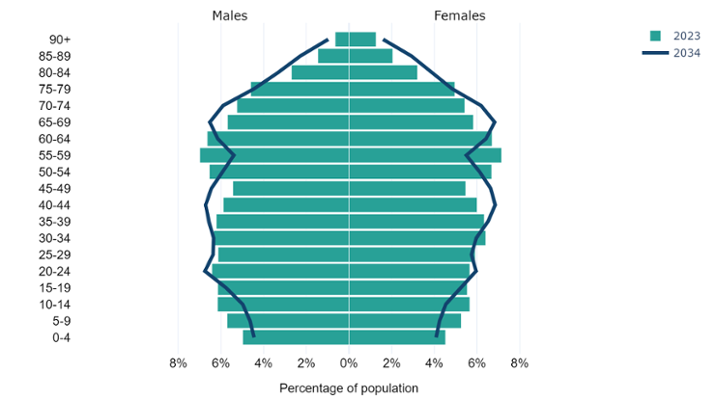
Figure 11: Population pyramid showing the latest and projected population makeup for Wales. This shows Wales is projected to have an older population, with higher percentages in the 70+ age groups, which are most affected by cardiovascular disease (Mid-Year Population Estimates and 2020-based population projections, Office for National Statistics).
Studies have also shown a link between cardiovascular disease risk and ethnicity, with South Asian groups more likely to suffer a higher risk of mortality and morbidity from CVD (Ho et al., 2022).
There are also genetic conditions, such as familial hypercholesterolaemia, where the liver cannot process cholesterol properly, and affects 1 in 250, or 13,000 people, in Wales (British Heart Foundation, 2025).
9.6 Air quality
Poor air quality can have a significant impact health. Air quality modelling verified by air quality monitoring can be used to estimate the concentration of pollution in the air. UK regulations require the measurement of a number of air pollutants, the most commonly monitored are; the concentration of particles with a diameter smaller than 10 micrometres (PM10) and those which are smaller than 2.5 micrometres (PM2.5) and Nitrogen Dioxide (NO2) as at many locations the air quality objectives for these pollutants are exceeded. The size of the particulate matter fractions is important as it means they may enter the bloodstream and be transported around the body, lodging in the heart, brain and other organs, increasing the risk of developing heart and circulatory diseases amongst others. For comparison, a human hair is about 70 micrometres in width. Exposure to NO2 can harm the heart and lungs.
Air quality has broadly been improving since 2007. The average concentration of nitrogen dioxide (NO2) in Wales has almost halved, from a concentration of 14µg/m3 in 2007 to around 8µg/m3 in 2022. In the same period, PM10 has decreased from 16 µg/m3 to 11 µg/m3, and PM2.5 from 9 µg/m3 to 7 µg/m3 (Air Quality in Wales, Welsh Government). However, there is no safe level of air pollution exposure and air quality can vary greatly at a local level, with the greatest impact experienced by the most vulnerable (the young, elderly and those with pre-existing medical conditions).
9.7 Data availability
As highlighted in section 9.3, there are gaps in data collection. While this is not a risk in a medical sense, the same way living with obesity is, data plays an important role in modern healthcare and public health. High quality data are vital for identifying, monitoring and improving the health and wellbeing of Wales on a large scale. Access to robust, high quality, detailed data would provide benefits, such as:
- detailed data on individuals with cardiovascular risk factors and diseases can help identify demographics that may be at higher risk (i.e. age, sex, ethnicity and BMI);
- this in turn can allow targeted health interventions/promotions;
- long term prevalence data, paired with context around health interventions, can help measure the impact of interventions;
- monitoring of the provision of treatment can help identify if the appropriate treatments are being offered;
- monitoring of the adherence to treatment to ensure patients are consuming the prescribed medication to ensure it is working as intended.
10. What Can Work
Chief Medical Officers across the UK recognise the need for programmes to tackle cardiovascular disease through both primary and secondary prevention (Whitty et al., 2023). Primary and secondary prevention are defined as:
“Evidence based, preventive measures to help stop or delay disease, taken during an interaction between an individual patient and a clinician. These are distinct from primary prevention at a population level. Primary and secondary prevention are both important and mutually supportive”
Primary prevention is intended to prevent disease or injury before it occurs. In the case of cardiovascular disease prevention, this is done by preventing exposures to risk factors, and developing initiatives that support behaviour change. For example, the UK has seen great success in the past with reducing smoking prevalence through a multi-pronged approach encompassing education, programmes, services and legislation, including the UK’s comprehensive tobacco control policies (Cairney, 2019). These have contributed to the UK having one of the lowest rates of smoking amongst similar developed countries.
Replicating this approach across other risk factors, such as obesity, could lead to a similar success in reducing the number of people living with obesity. This in turn, would likely lead to a reduction in the prevalence of avoidable cardiovascular risk factors, such as atrial fibrillation and hypertension, and a reduction in avoidable mortality due to cardiovascular events such as strokes and heart disease.
In addition, secondary prevention, as defined above, typically involves early detection of risk factors to reduce the risk of a cardiovascular event, or early detection and intervention to stop established cardiovascular disease from progressing. Clinician-led interventions such as referrals to support for smoking cessation and weight management programmes have been shown to have important effects on cardiovascular disease progression. In addition, there is evidence, and NICE Guidance, to show that the identification and treatment of key clinical risk factors such as atrial fibrillation, hypertension, and cholesterol, alongside associated illnesses such as diabetes, can substantially reduce the incidence of cardiovascular disease and its progression.
Primary and secondary prevention interventions are both important. Primary prevention can reduce the prevalence of avoidable cardiovascular risk conditions and disease, and therefore reduce impacts on the health service. Secondary prevention intervenes early to treat cardiovascular risk factors and prevent life changing cardiovascular events from occurring. As stated by the Chief Medical Officers in 2023:
“Evidence that secondary prevention can substantially reduce disease incidence and progression is some of the strongest in medicine. The beneficial effects of secondary prevention of cardiovascular disease, including risk-based advice and prescription of appropriate antihypertensive agents and statins, are profound and rapid.”
11. An overview of services, programmes, prevention services and legislation in Wales
Here, we outline some of the strategies and legislation, programmes and services aimed at reducing the prevalence of some of the risk factors described in this article. This is not an exhaustive list, and if you have a programme or service you would like added to the list, please do not hesitate to contact us via Publichealthwalesobservatory@wales.nhs.uk.
11.1 Strategies and Legislation
- Healthy Weight, Healthy Wales: the Welsh Government’s delivery plan to prevent and reduce obesity.
- Tobacco and Vapes Bill: introduced into the House of Commons on 5 November 2024, it would make it illegal to sell tobacco products to anyone born after 1 January 2009 and includes proposals to create powers for UK and devolved administrations to extend smoke and vape-free spaces, restrict vape packaging, display and flavours and to licence tobacco and vape retail outlets.
- Legislation passed by Welsh Government and the other UK nations will ban disposable vapes from June 2025.
- New legislation to restrict the placement and price promotion of products high in fat, sugar and salt.
- Public Health (Minimum Price for Alcohol) (Wales) Act 2018.
- Environment (Air Quality and Soundscapes) (Wales) Act 2024: The Act allows Welsh Ministers to set targets in relation to air quality, creates new duties for the Welsh Ministers to take steps to promote awareness of the risks to human health caused by air pollution, and ways of reducing or limiting air pollution and places a duty on Welsh Ministers to promote active travel as a way of reducing or limiting air pollution and makes provision for this duty to be imposed by regulations, on other public authorities.
- The Restricted Roads (20mph Speed Limit) (Wales) Order 2022 aims to reduce road traffic casualties, but also to encourage more walking and cycling (which will also reduce air pollution) and improve health and well-being, all of which will reduce risks of cardiovascular disease.
11.2 Services supporting CVD risk factors
11.2.1 Health Checks
- Cwm Taf Morgannwg Cardiovascular Health Check Programme
- The cardiovascular risk assessment aims to support a reduction in inequalities in life expectancy between socioeconomic groups, by identifying patients at a high risk of CVD and providing them with appropriate medication and behaviour change support.
11.2.2 Optimising treatment of cardiovascular disease risk factors (ABCD)
- Atrial fibrillation
- Stop a Stroke Quality Improvement Programme e.g. Stop a Stroke Campaign - Cardiff and Vale University Health Board).
- Blood pressure
- Size of The Prize is a modelling tool designed by UCL Partners and utilised across England to show how the NHS could prevent thousands of heart attacks and strokes by optimising the treatment of common risk factors like blood pressure and cholesterol. Data is being collated to develop a Size of the Prize for Wales.
- Cholesterol
- Familial Hypercholesterolemia (FH) Service Wales. FH is caused by an abnormal gene which results in very high cholesterol levels in the blood. People with Familial Hypercholesterolemia, if untreated, are at an increased risk of early coronary heart disease. The Familial Hypercholesterolemia Wales Service identifies and treats individuals and families in Wales.
- Diabetes
- The All Wales Diabetes Prevention Programme (AWDPP), led by Public Health Wales, offers targeted support to people who are at an increased risk of type 2 diabetes, with the aim of preventing them from developing this condition.
- Structured diabetes education programmes such as DESMOND.
11.3 Services supporting behavioural risk factors
- Healthy Weight Healthy You is a comprehensive strategy by Welsh Government aimed at preventing and reducing obesity. As part of this the Healthy Weight Healthy You programme offers personalised guidance to support individuals to manage their weight effectively. Health boards across Wales also offer services to support individuals to manage their weight.
- Help Me Quit was launched in 2017 and is a single brand for NHS stop smoking services in Wales. Help Me Quit is delivered by Public Health Wales and local health boards.
- The National Exercise Referral Scheme (NERS) is a Welsh Government funded health intervention incorporating physical activity and behavioural change techniques to support referred clients to make lifestyle changes to improve their health and wellbeing.
- Dan 24/7: Free bilingual helpline to support people with drug and alcohol dependence.
12. Data quality and interpretation
12.1 COVID-19 pandemic
When considering these trends, it is important to consider the potential impact of the COVID-19 pandemic and primary care management in general. During the pandemic, access to services would have been reduced. This could have potentially led to a fall in diagnosis and treatments, followed a surge once available again, hence the sharp increase in the latest year. In relation to the general decline, as we can see from the prevalence data, conditions associated with cardiovascular disease are not in decline. The decline in admissions may be a result of better primary care management, through prescriptions for example.
12.2 Prevalence data
The prevalence data are from the Quality and Outcomes Framework (2009/10 to 2018/19) and the Quality Assurance and Improvement Framework (2019/20 onwards) from Welsh Government. This data, supplied by GPs, shows the number of registered patients on a particular disease register and the total registered population.
Primary care registers should be interpreted with some caution, as some changes may not be due to an actual change in prevalence. As medicine progresses, methods may be developed to detect conditions more effectively, leading to better identification as opposed to an actual increase. Conversely, when QAIF replaced the QOF in 2019/20, the change in the contract regarding how data collected from primary care is financially rewarded has potentially led to changes in data quality, primarily a potential reduction in reporting, leading to an undercount of prevalence. This is particularly true when the changes are small, as it is not possible to say with absolute certainty if it represents a true change or is due to a change in data collection.
The data comes from a single data source based on GP registered patients. As a result, it does not capture anyone who may be undiagnosed, or diagnosed but not registered. This means that the figures provided are potentially an undercount of the true prevalence.
12.3 Projection methods
For our projections, we have used a standard time series model known as an ARIMA model. The model projects historic prevalence and incidence counts forward to 2033/34. We have also provided 95% upper and lower confidence intervals, estimating an interval in which a future prevalence might fall. These indicate that we believe with 95% certainty that the figure would fall somewhere between these counts, assuming current trends continue. These are available in the data download. The figure we refer to in the article, the central estimate, is the most likely estimate, given what has already been observed. The further forward we project, the less confidence we have in the estimates.
We do not expect these projections to be precise, and merely show a likely direction of travel should nothing change in between. For example, the introduction of a health or policy intervention aimed at reducing unhealthy behaviours, such as when smoking bans were introduced.
If you would like more information on the technical details of the projections, please do not hesitate to contact us via Publichealthwalesobservatory@wales.nhs.uk.
12.4 Patient Episode Database Wales
Our admissions data uses the Patient Episode Database Wales (PEDW). PEDW is a national database which captures information on hospital activity. These data are provided by health boards. Variations in data completeness, such as missing diagnosis fields and admission methods, can impact the accuracy of analyses. As such, analyses should be interpreted with caution as it may underestimate the true figure, however this does not undermine the findings of the analysis. Due to this we are not showing breakdowns where more than 10% of admitting episodes were missing a primary diagnosis. We have compiled a list of the excluded breakdowns for reference. More information on PEDW completeness can be found on the DHCW website.
12.5 Self-reported survey data
Data relating to lifestyle behaviours are collected through the following surveys:
- Welsh Health Survey
- National Survey for Wales
As with all surveys, they are reliant on self-reported data, which can be affected by various sources of bias, such as social desirability, recall, or response styles. For example, people may under-report how often they consume alcohol and over report how often they exercise.
Sample sizes affect the degree of confidence with which we can report findings. Where possible, we have included 95% confidence intervals in the data downloads. This represents a range of values that we can be 95% confident contains the ‘true’ underlying rate. In general, the larger the sample size, the smaller the gap between the upper and lower confidence intervals.
This article reports observed percentages without adjusting for changes in age structure. Age standardised percentages would provide fairer comparisons over time, especially for age-influenced behaviours and will be added to data downloads later. Currently, observed percentages are presented to highlight their direct impact on services and planning since they represent the actual percentage in the population.
12.6 Welsh Health Survey
The Welsh Health Survey ran from 2003/04 to 2015 and had a target sample of 15,000. In 2016, the Welsh Health Survey was replaced with the National Survey for Wales. Archived data and technical reports are available online.
12.7 National Survey for Wales
The National Survey for Wales replaced the Welsh Health Survey in 2016. Although it is the successor to the Welsh Health Survey, they should not be compared. This is because as the survey methodology changes, we may see a step change due to this, as opposed to a natural change. For some healthy behaviours, there may also be a change in the CMO guidelines, meaning a long-term analysis is unavailable. However, while you will need to consider this step change as the methodology changes, you are still able to draw some conclusions about long-term trends. Only two analyses cover both surveys, BMI and smoking trends. The categorisation for both remains the same throughout the periods; however, there may be a small step-change between surveys that may be due to the change in survey as opposed to a natural change.
Due to the covid-19 pandemic, the National Survey for Wales had to change its usual delivery method, which consisted of a mixture of face-to-face and telephone interviews. The monthly and quarterly surveys between May 2020 and March 2021 were large-scale, random sample telephone surveys, reaching around 1,000 people a month, for a total of 12,000 over the year. From July 2021, a subsample of respondents were asked to complete an online section following the telephone section. Because of this method change, results cannot be directly compared. However, as with the change from Welsh Health Survey to National Survey for Wales, although any step-change must be considered, it does not mean that there has not been an actual behavioural change following the COVID-19 pandemic. This is why considering the long-term data series is crucial. Further information on the survey methodology and technical information are available from Welsh Government.
12.8 Child Measurement Programme for Wales
The Child Measurement Programme for Wales (CMP) collects measurements of height and weight for 4-5 year olds who attend school in and live in Wales. In the 2022/23 academic year, 29,916 children were measure out of 32,703 eligible children, a participation rate of 91.5%. The CMP was established by Welsh Government statute in 2011, and the first annual report was released in 2013. A full data quality statement is available online, as well as data via our dashboard.
12.9 Air quality
The UK monitors air quality nationally through a number of networks of monitoring stations. The largest network, monitoring concentrations of the most well-known pollutants is called the Automatic Urban and Rural Network (AURN), which reports data hourly in near real-time on the UK-AIR website. In addition there are Local Authority and academic operated monitoring networks.
National statistics on air quality in the UK are produced in April each year and provide an accessible assessment of long-term trends in air quality as measured by the AURN. In September each year, measurements from the national monitoring networks are combined with modelling outputs to form a national assessment of air quality against the limit and target values for concentrations of air pollutants set internationally and domestically. The government publishes an annual report on the results of this assessment, and the modelling data used for this report are published in an interactive map on the UK-AIR website.
Each year the UK Government’s Pollution Climate Mapping (PCM) model calculates average pollutant concentrations for each square kilometre of the UK. The model is calibrated against measurements taken from the UK’s national air quality monitoring network.
The Welsh Government has used these published data to assign a concentration of NO2, PM2.5 and PM10 to each residential dwelling in Wales based on which square kilometre of Wales it sits in.
For each local authority and local health board, a population-weighted average over its constituent census output areas were calculated to give an average NO2, PM2.5 and PM10concentration based on where people live in those local authorities and health boards. The same calculation was also repeated over all census output areas, to give a comparable figure for the whole of Wales. For the 2022 update of the air quality national indicators, a methodological improvement was implemented to the way in which the dwelling weights are calculated. More information on the data used can be found on the Department for Environment Food & Rural Affairs website.
12.10 Prescriptions
The prescription data contains the total number of items prescribed (irrespective of where they were dispensed) or dispensed by General Medical Practitioners in Wales. Net ingredient cost refers to the cost of the drug before discounts and does not include any dispensing costs or fees. It does not include any adjustment where the patient has purchased a prepayment certificate. Net ingredient costs for all years are not adjusted for inflation. Standard adjustments for inflation are not considered appropriate as drug prices are subject to controls under the Pharmaceutical Price Regulation Scheme and to other central controls. More information on this data is available from Welsh Government.
13. Download the data
We are aware that there can be issues downloading the data files in Microsoft Edge. If you would like the data, you may need to use a different browser, use 'Save as' if the data opens in an online tab or contact us at Publichealthwalesobservatory@wales.nhs.uk
13.1 Download the data in this article – Excel
13.2 Download the data from this article with additional breakdowns - CSV
13.3 Download risk factor data with additional breakdowns - CSV